
The U.S. plumbing industry is expected to surpass $191 billion in 2026, and demand isn't slowing down. Yet many plumbing businesses are operating in a constrained market where they can’t fill 550,000 positions, material costs are up more than 30% since 2020, and the gap between median net margins (2–8%) and top-performer margins (20–35%) comes down almost entirely to how well you run the business.
These plumbing industry statistics for 2026 cover market size, employment, wages, demand drivers, material costs, technology adoption, and customer behavior. These numbers can help plumbing contractor businesses like yours orient themselves and paint an operational picture.
Plumbing Industry Statistics 2026: Key Takeaways
Here's where the industry stands in 2026:
- The U.S. plumbing market is projected to hit $191.4 billion in revenue in 2026, representing a 3.1% compounded annual growth rate (CAGR) over five years.
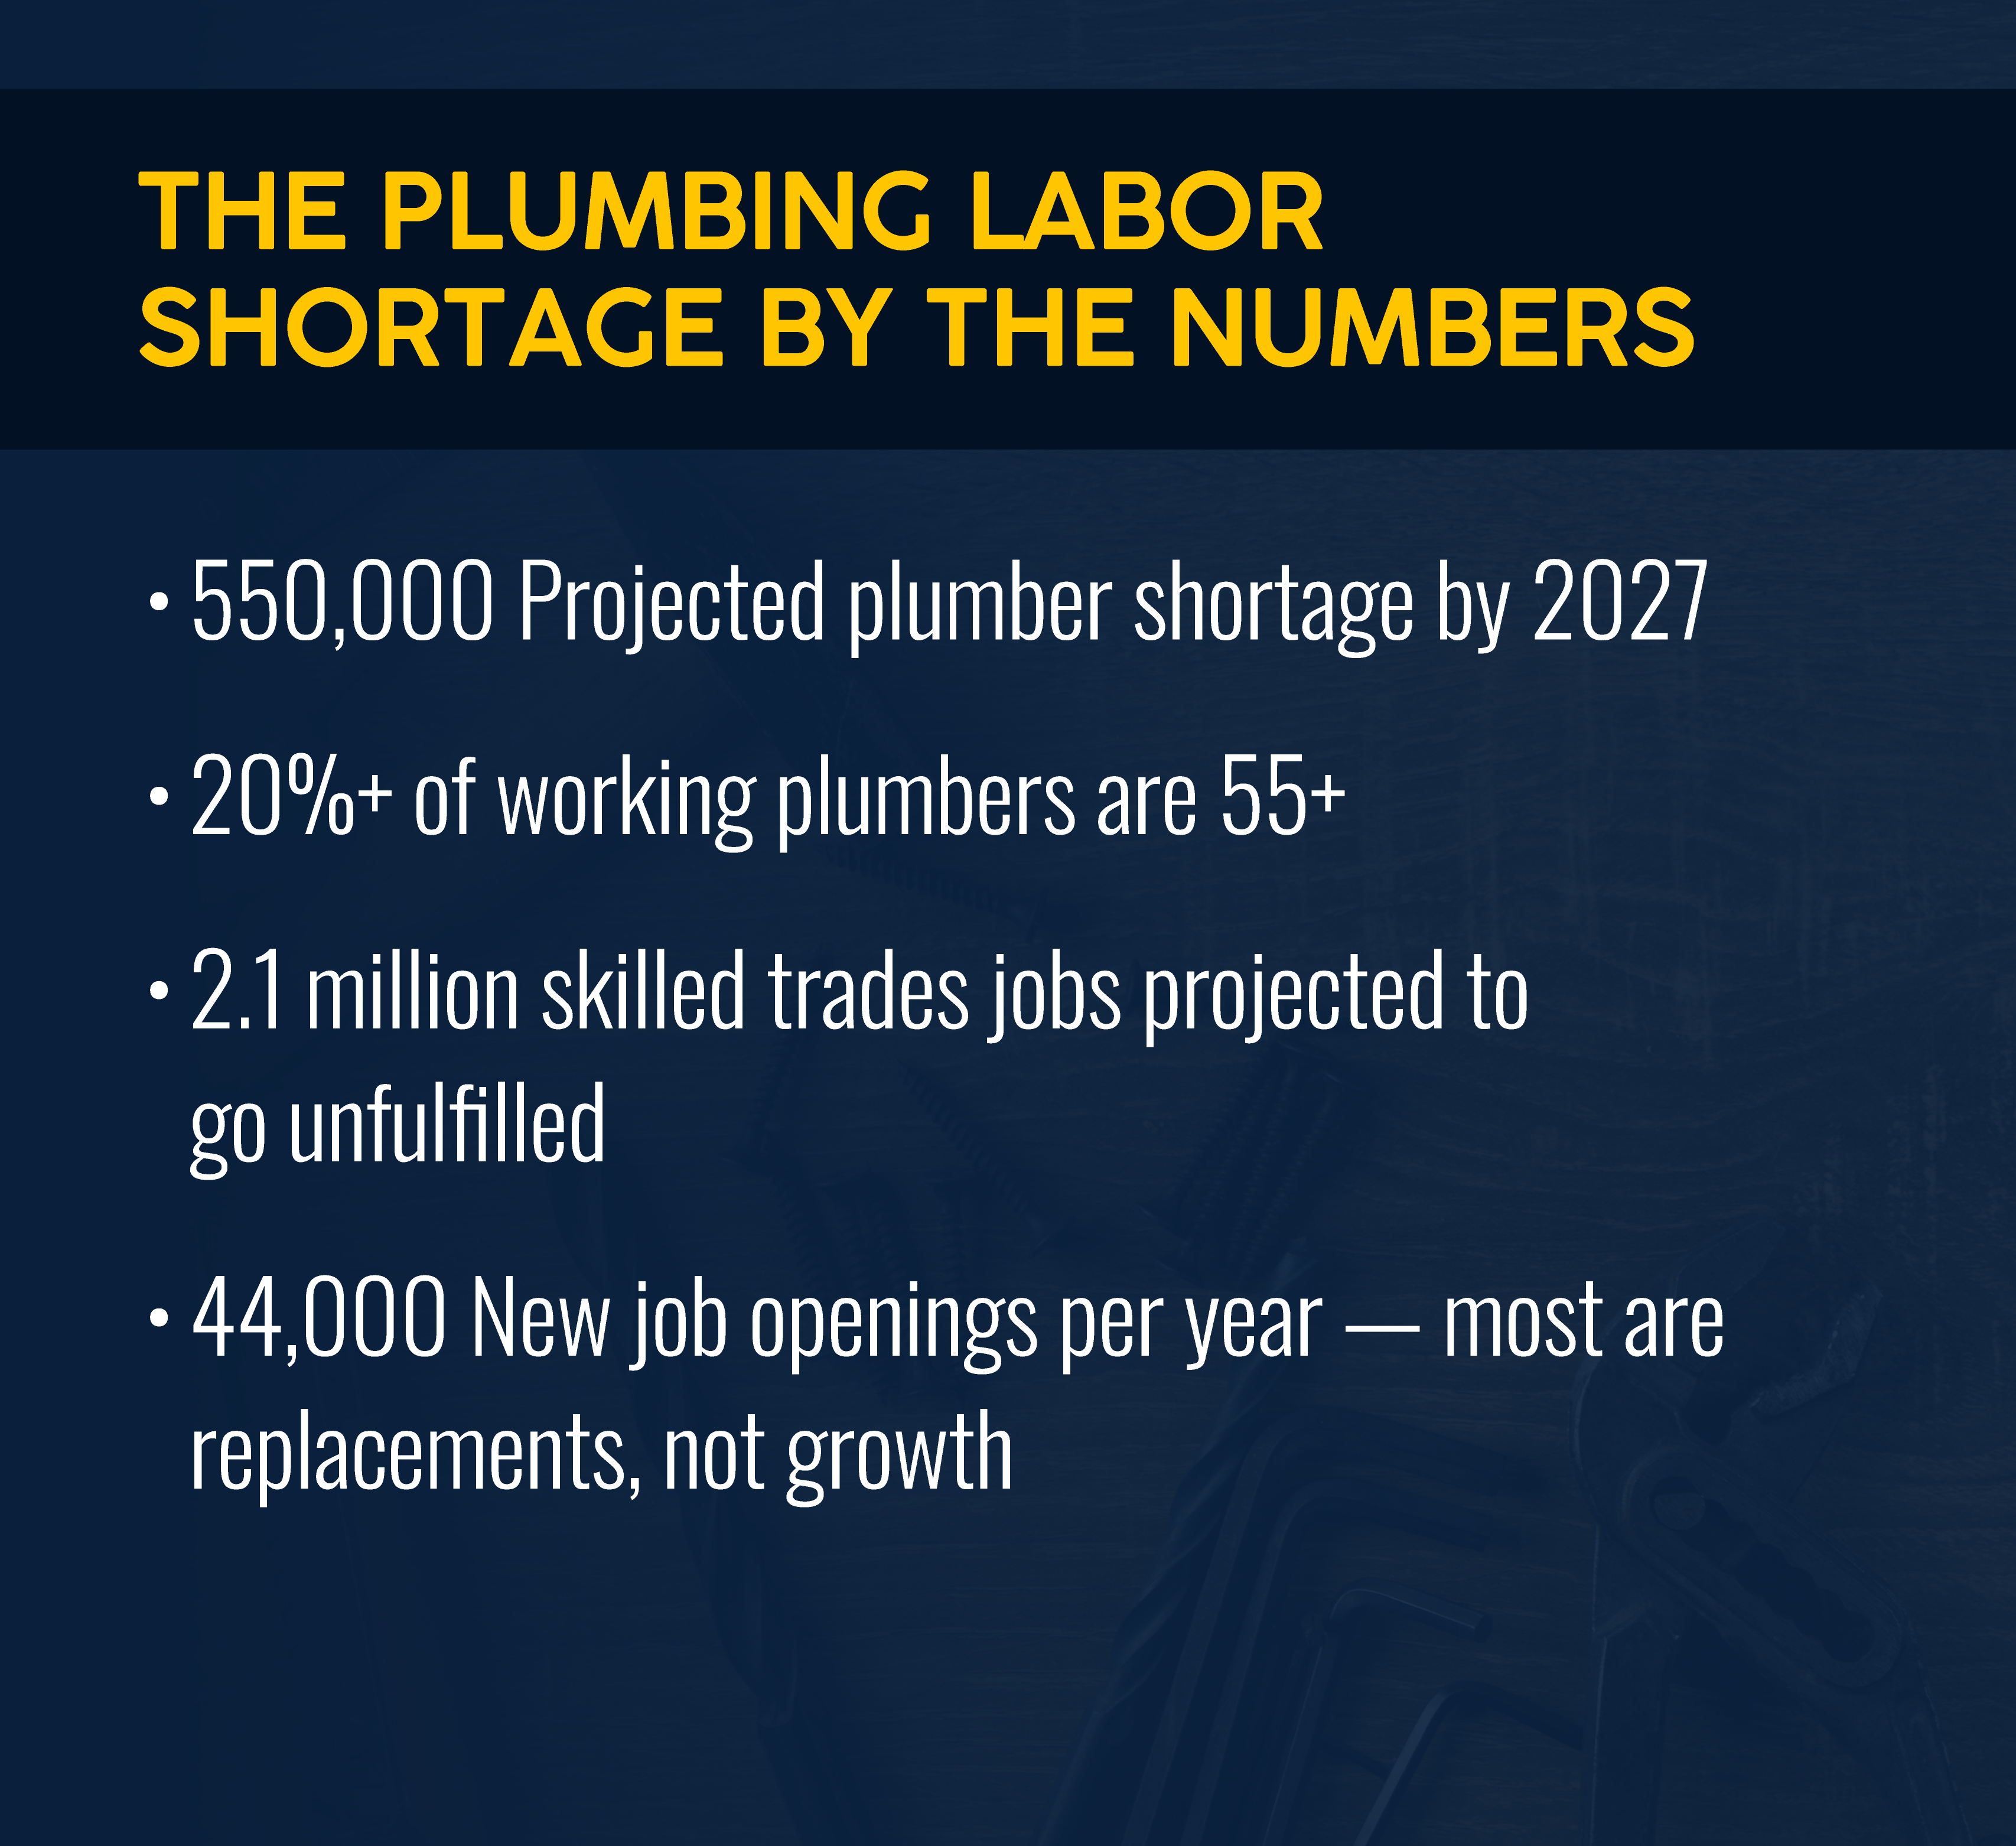
- A projected 550,000-plumber shortfall is expected by 2027, costing the economy roughly $33 billion annually.
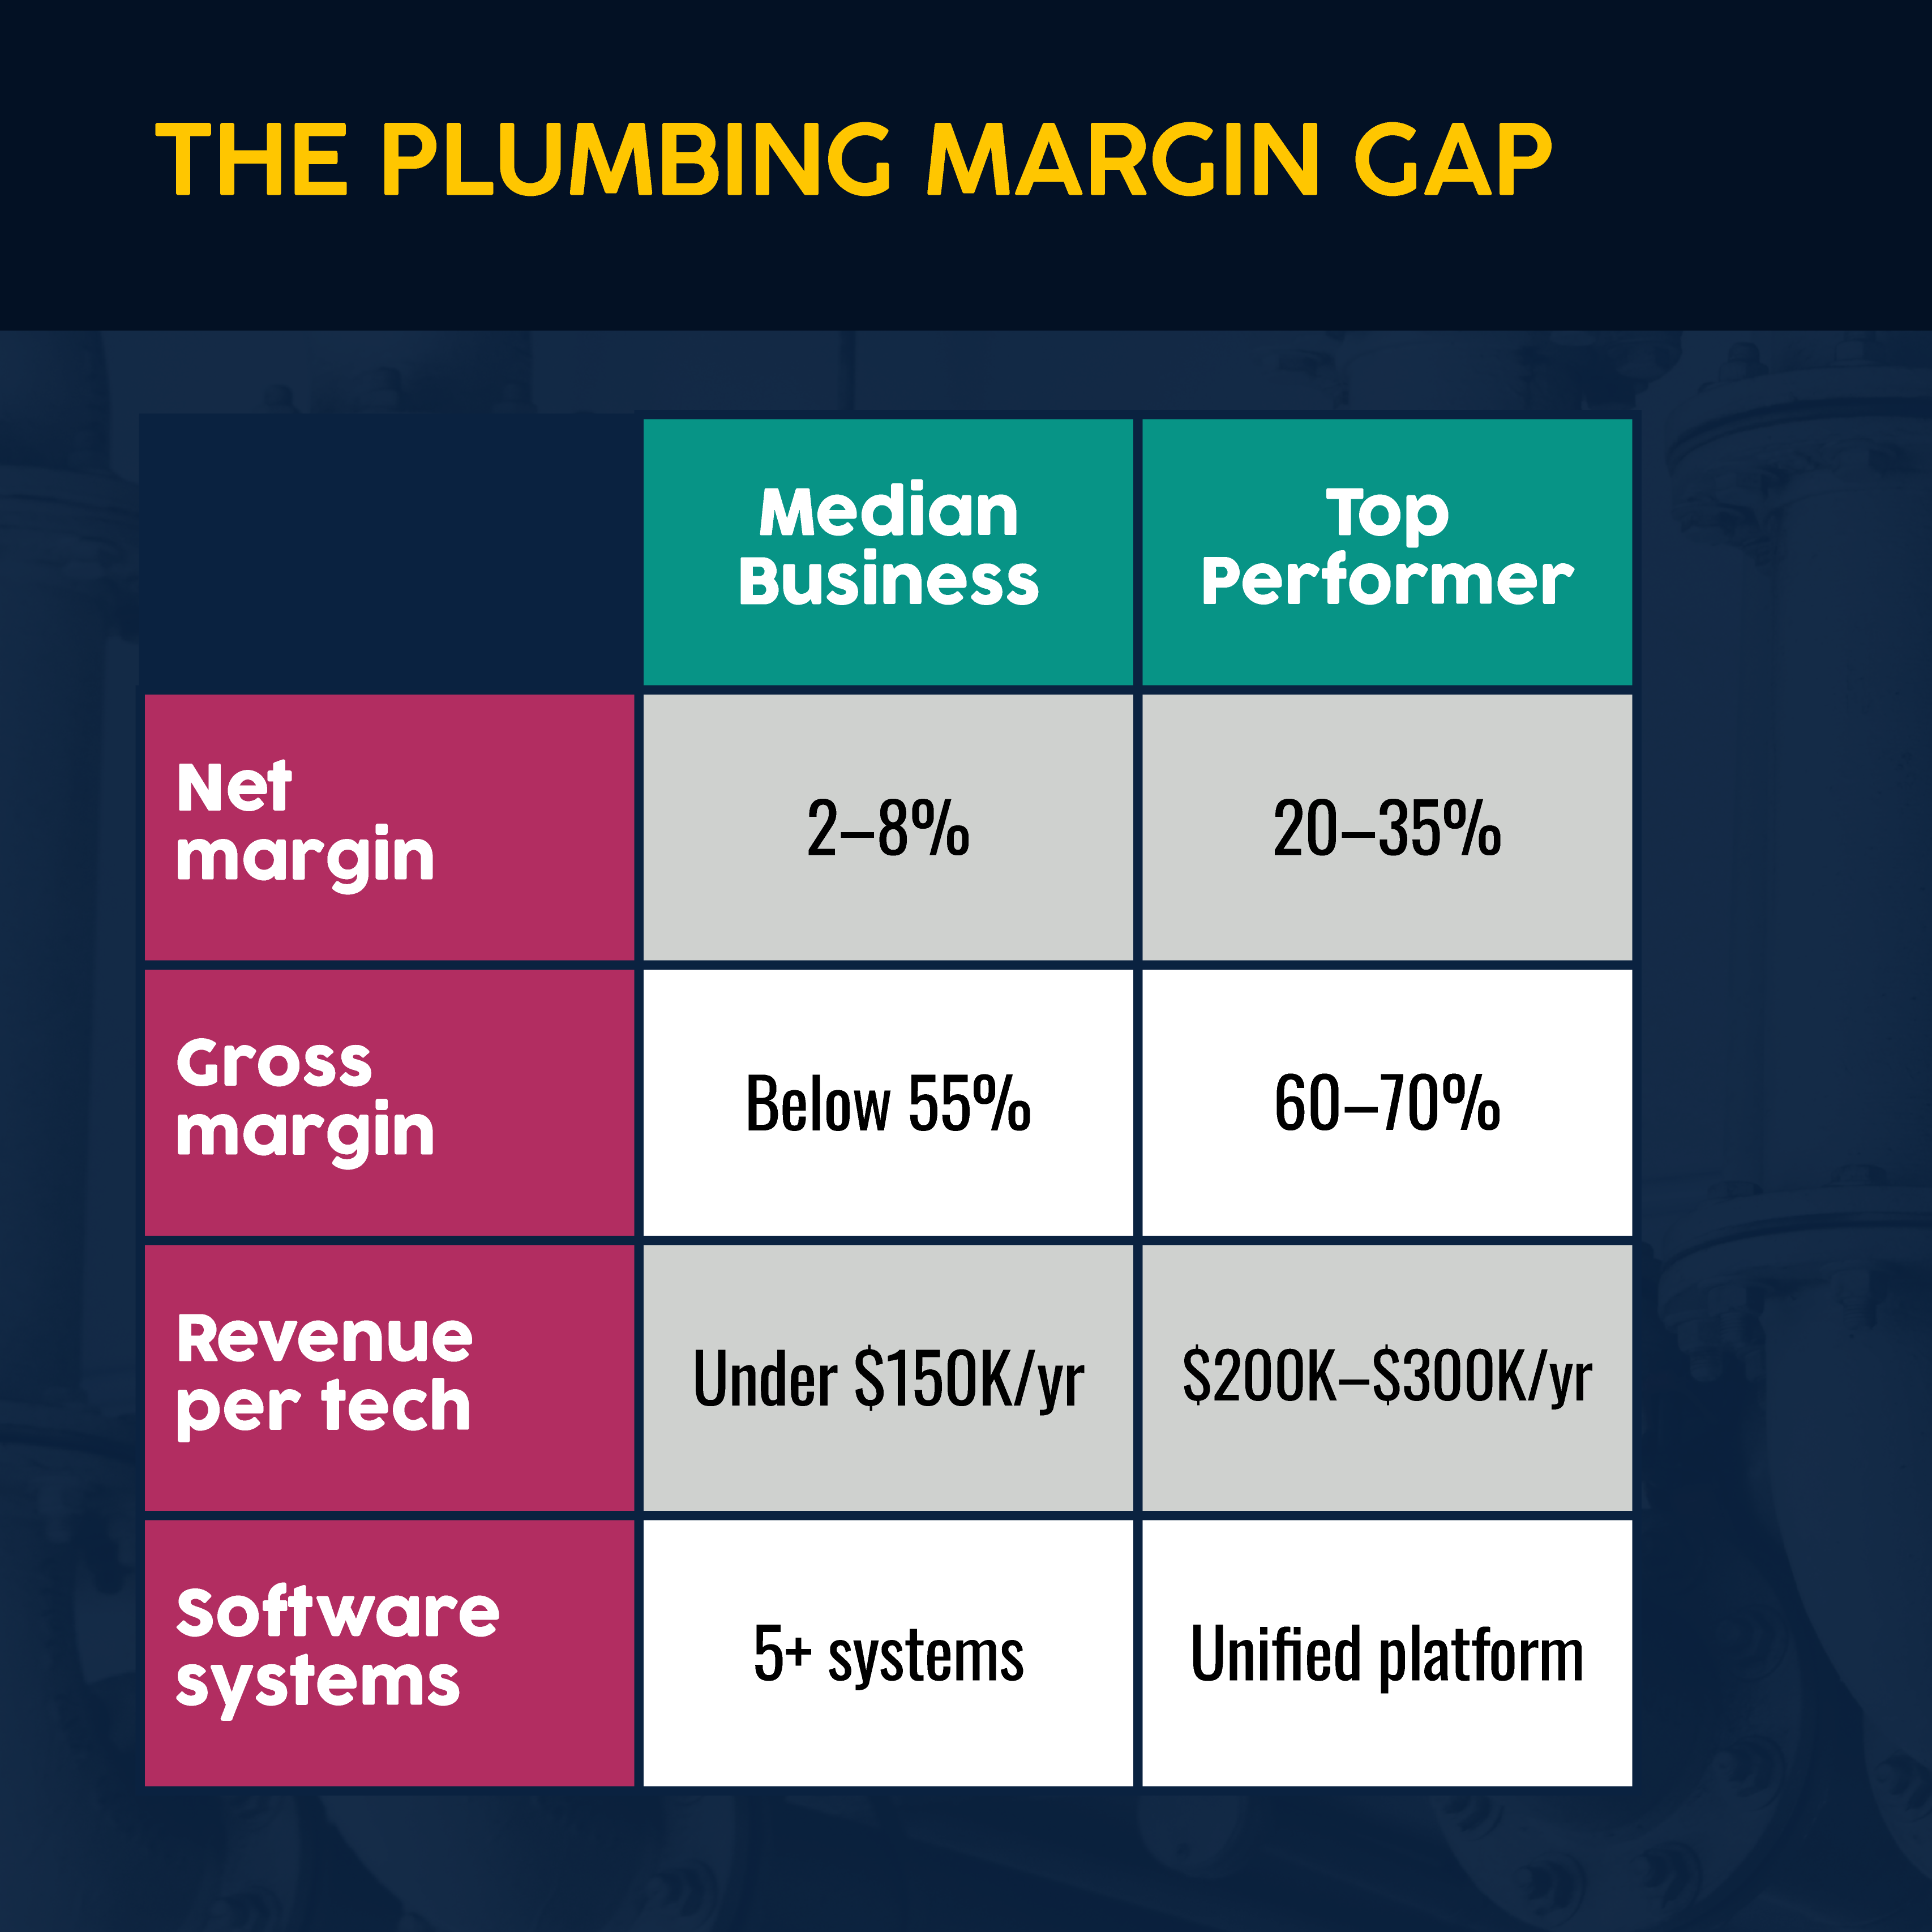
- Industry-leading plumbing businesses operate at 20–35% net profit margins. The median sits closer to 2–8%.
- The U.S. home remodeling market is projected to grow from $522.5 billion in 2025 to $812.8 billion by 2034.
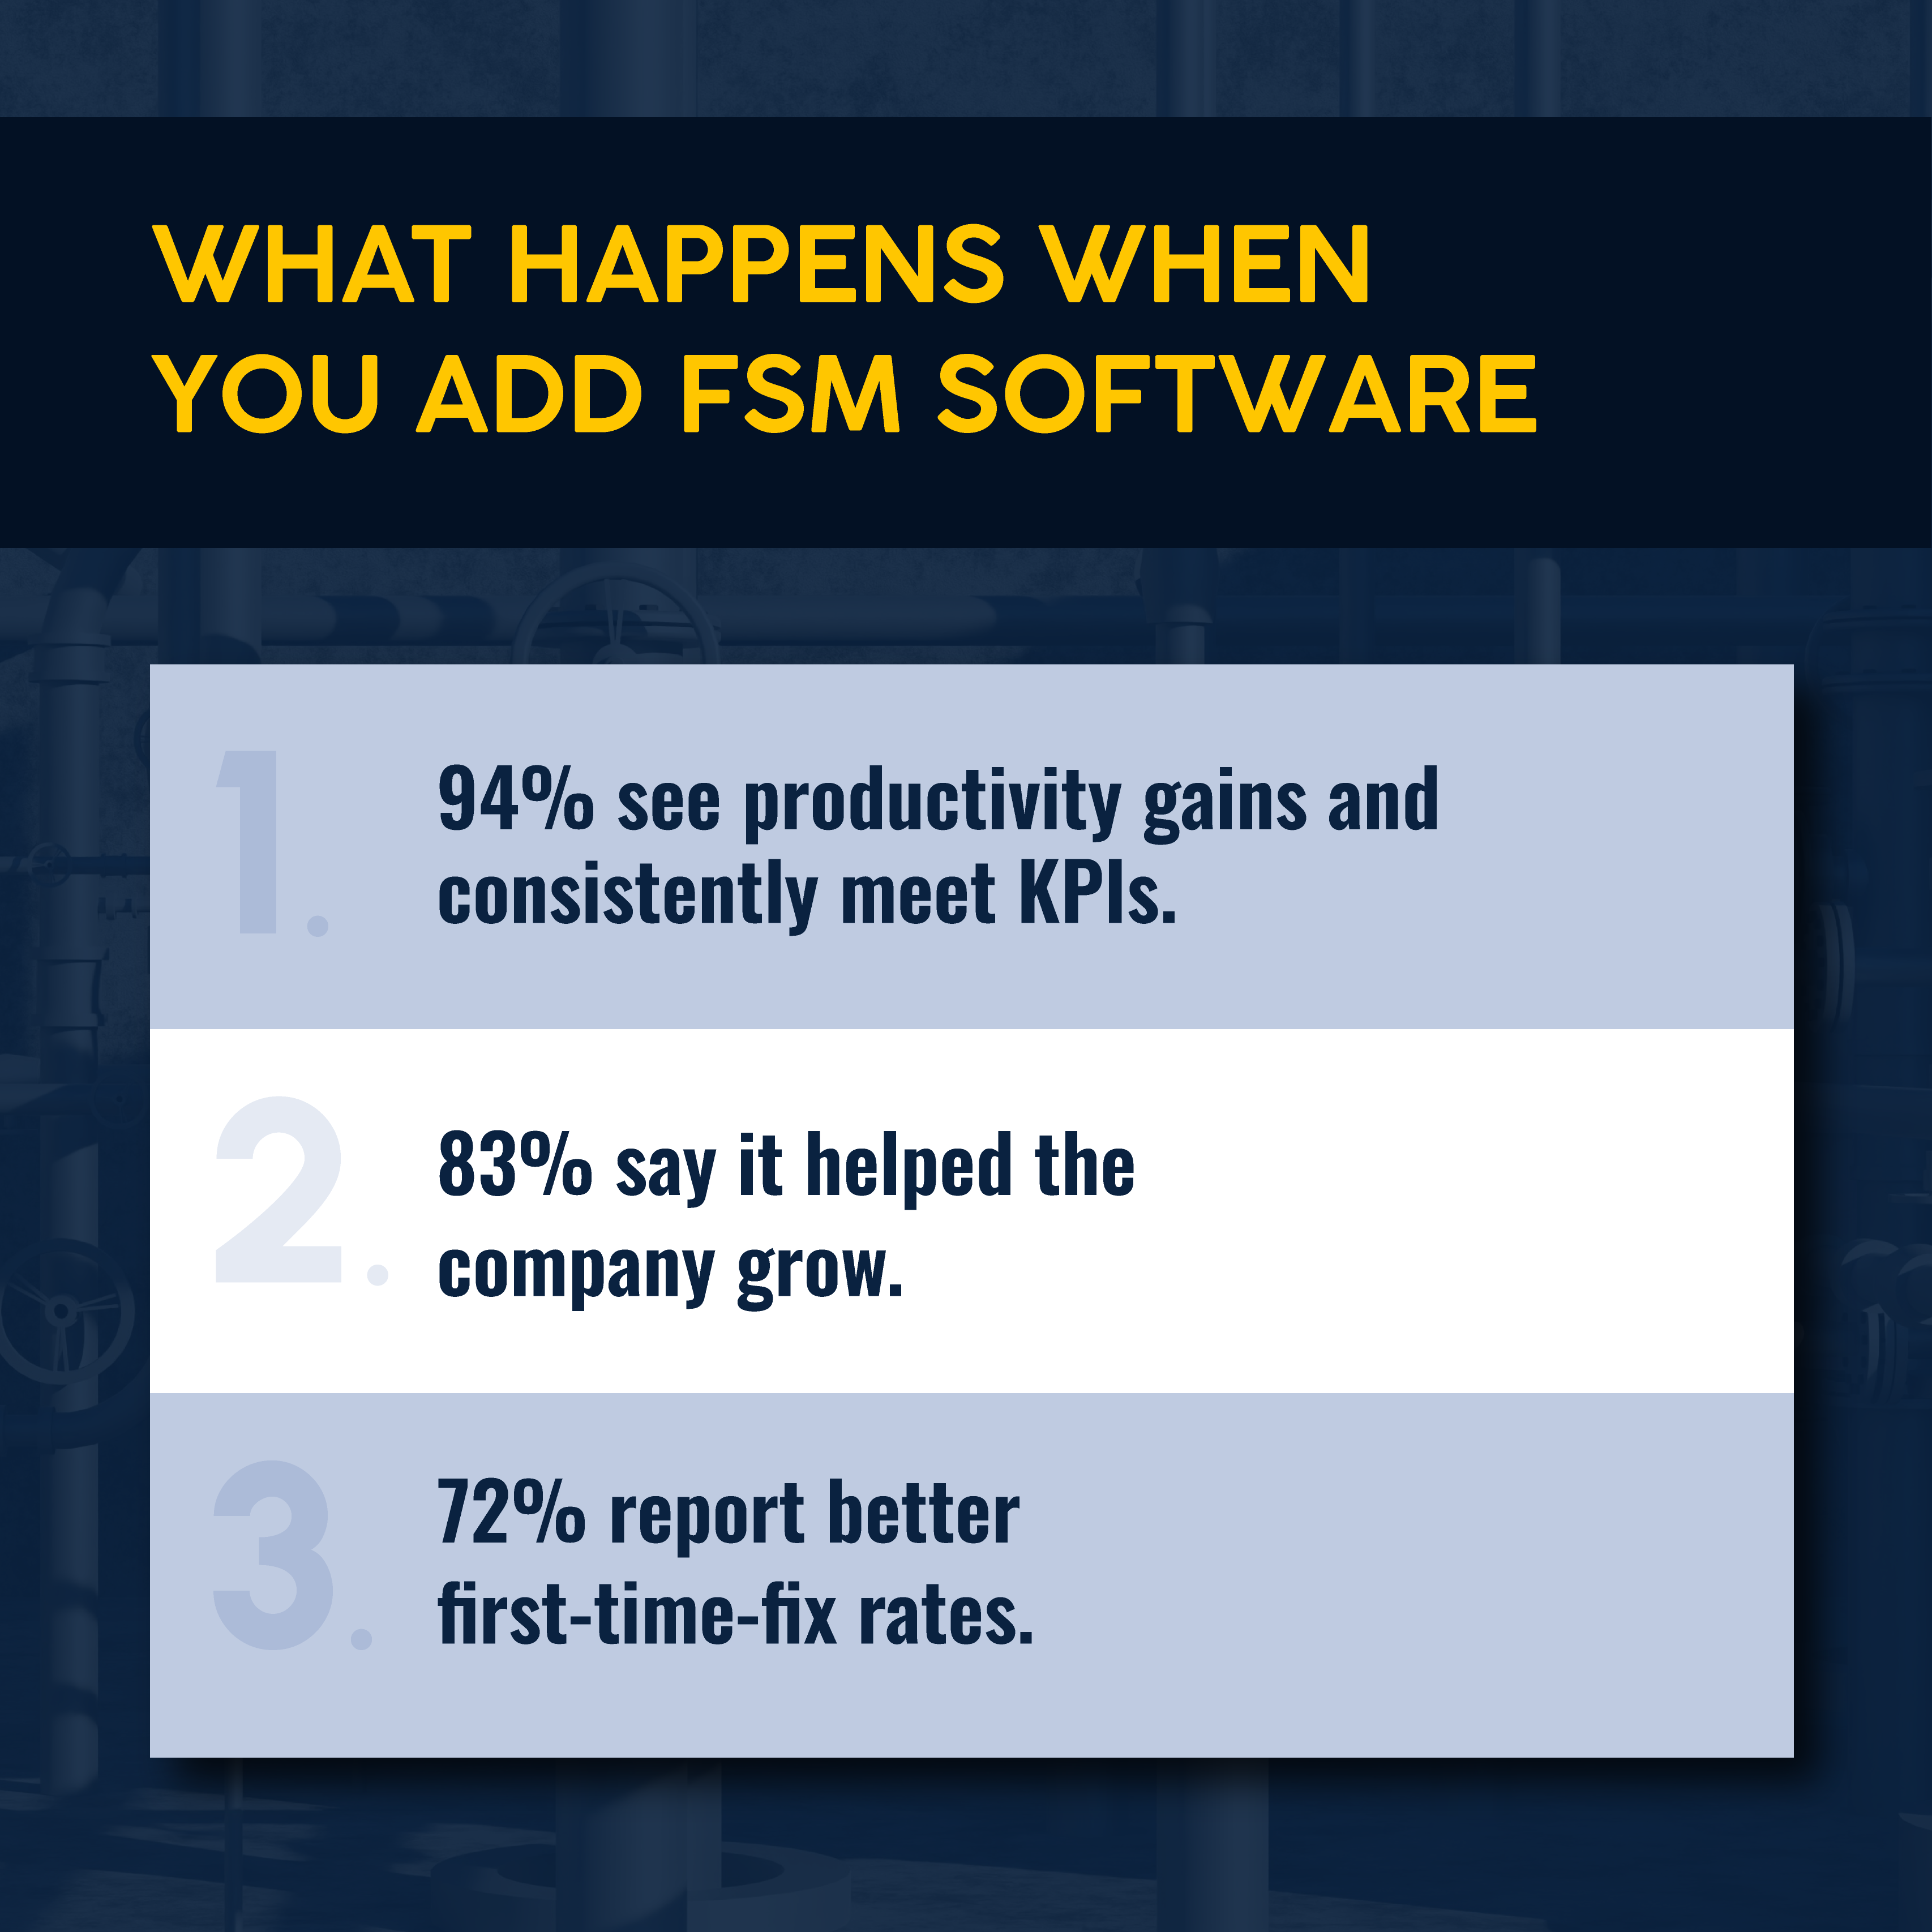
- 94% of companies using field service management (FSM) software report gains in productivity.
- Fixture and material costs have risen more than 30% since 2020, tightening margins on every job where pricing hasn't kept up.
1. Plumbing Market Size and Revenue Statistics
The plumbing industry is bigger than most contractors realize — and expected to grow. The market covers general plumbing, commercial pipefitting, specialty systems, and a smart-technology segment that's expanding at nearly double the pace of the industry overall.
1. The U.S. plumbing industry will generate $191.4 billion in revenue in 2026, growing at a 3.1% CAGR over the past half-decade. (IBISWorld)
2. Roughly 129,000 plumbing businesses employ over 742,000 people across the United States; Approximately 60,940 small and medium-sized businesses across the plumbing and heating and air conditioning industries employ fewer than five people. (IBISWorld; IBISWorld; Statista)
3. The average plumbing business in the U.S. generates approximately $1.48 million in annual revenue in 2026, based on the above IBISWorld data.
4. Nonresidential construction accounts for more than two-thirds of U.S. plumbing industry revenue, despite residential work dominating most trade content and conversation. (IBISWorld via Linxup)
5. The plumbing industry is highly fragmented. No single company holds more than 5% market share. (IBISWorld)
Plumbing Employment and Labor Statistics
Strong demand, an aging workforce, and a pipeline that isn't filling fast enough. That's the job outlook in plumbing right now. Each of these numbers directly affects how contractors plan their capacity.
6. The U.S. has 504,500 employed plumbers, pipefitters, and steamfitters, as of 2024. (Bureau of Labor Statistics)
7. Employment is projected to grow 4% from 2024 to 2034, on par with the overall U.S. job market. Expect roughly 44,000 new job openings annually over that period. (BLS)
8. From 2022-32, hiring for trades, including plumbing, is projected to be more than 20 times the net new job growth rate — the vast majority of hiring is replacement, not expansion. (McKinsey)
9. The U.S. is forecast to face a shortage of approximately 550,000 plumbers by 2027. Adding even a small number of plumbers could create billions in economic benefits. (LIXIL)
10. 55% of plumbers report labor shortages as of 2024. (NAHB)
11. More than 20% of plumbers are over 55, and by 2030, more than 2.1 million skilled trades jobs could go unfilled. (Consumer Affairs via BLS; Department of Education)
Businesses struggle to grow headcount because of surging retirements and not enough incoming talent, not to mention any retention issues. Businesses that wait to systematize will find themselves rebuilding workflows every time they lose a technician.
The operational fix: Before posting a job opening, check how much revenue each current technician generates annually. If you're below $150,000 per tech, the constraint is almost certainly scheduling or utilization, not headcount.
Plumber Salary and Wage Statistics
Wage data matters for two reasons: hiring conversations and job costing. If your labor cost assumptions don't reflect current market rates, your estimates are wrong before a truck rolls.
12. The median annual wage for plumbers, pipefitters, and steamfitters is $62,970 as of May 2024, or $30.27 per hour. (BLS)
13. As of May 2025, the top 10% earn over $108,420, or $52.13 per hour; the bottom 10% earn no more than $44,150, or $21.22 per hour. (BLS)
14. Master plumbers typically earn $75,500–$86,000 annually at the national median, with the top 10% earners exceeding $107,000, reflecting labor scarcity and increased leverage for experienced tradespeople. (ZipRecruiter)
15. The top-paying states for plumbers, pipefitters, and steamfitters are Illinois, Oregon, and Montana. (Construction Coverage)
16. Plumbing business owners typically earn $94,000 to $120,000 in salary, with bigger earning potential for plumbing systems that scale. (BDR)
Residential and Commercial Plumbing Demand Statistics
Plumbing demand is built on things that don't change regardless of the economy: old homes, aging infrastructure, and pipes that break. These numbers explain why most plumbing calls are nondiscretionary and why growth constraints are usually about capacity, not customers.
17. Between 70–80% of plumbing service calls are urgent, i.e., emergency or can't-wait situations. That nondiscretionary demand makes plumbing a relatively recession-resistant trade. (BDR)
18. The median age of U.S. homes is 44 years. Aging housing stock drives repair and replacement spending across mechanical systems and home services, including plumbing. (Harvard Joint Center for Housing Studies)
19. NAHB forecasts residential remodeling to post a 3% gain in 2026 and 2% in 2027, driven by homeowners investing in existing properties rather than moving in a high-rate environment. (NAHB)
20. The U.S. home remodeling market was valued at $498.3 billion in 2024, projected to grow from $522.5 billion in 2025 to $812.8 billion by 2034 at a CAGR of 5%. (Global Market Insights)
21. America's drinking-water infrastructure requires more than $625 billion over the next 20 years to reach a state of good repair, a 30% increase over the prior EPA projection. Approximately 240,000 water main breaks occur annually, wasting over 6 billion gallons of treated water daily. (ASCE 2025 Infrastructure Report Card; EnergyCAP)
The operational fix: The $625 billion figure signals a long-term pipeline for commercial and municipal contractors, while the residential remodeling numbers offer near-term optimism for service and repair businesses. Both point to a sustained, structurally driven workload. The growth constraint is capacity, not demand.
Plumbing Material Cost and Profit Margin Statistics
The margin gap in plumbing is real. Material cost increases in the 2020s haven’t helped. The businesses running at 20–35% net are changing up their operations, not just charging more.
22. Plumbing fixture and material costs have risen more than 30% since 2020, with increases continuing in 2026. (BLS; ContractorPlus)
23. 88% of business owners, including plumbers, say inflation has impacted their operations; 64% are raising prices. (Bank of America)
24. Industry experts recommend plumbing businesses target a gross margin of 60–62% to achieve healthy profitability. Healthy businesses maintain gross margins of 60–70%. (Simpro®; Brentwood Growth)
25. Aim for a net profit margin of 15–20%+. Even higher rates are possible through flat-rate pricing and tight cost controls. Many businesses operate at 2–8% net. (Simpro; Profitability Partners)
The operational fix: A blended margin across all service lines can hide a lot. Your average margin might look good — until you realize the commercial installation crew runs at 22% gross and the residential service team runs at 51%. The clearest picture lives in the division-level breakdown, not the blended number.
26. Revenue per technician at top-performing plumbing companies runs $200,000–$300,000 annually. Average ticket size for residential calls is $300–$500 per call; commercial ticket sizes are typically $800–$1,500 per call. Offering financing on plumbing jobs can further increase revenue. (Brentwood Growth)
The operational fix: If your net margin is below 10%, check gross margin by service line first, then job-level cost tracking. Businesses that track per-job cost in real time catch margin compression mid-month, not at the quarterly review.
Related: Plumbing profit margins: What the numbers actually mean for your business.
Plumbing Technology and Software Adoption Statistics
FSM software adoption used to be a differentiator. It's now closer to a baseline. The contractors who haven't moved yet are running behind, and the numbers make that gap visible.
27. 69% of trade business owners see AI as crucial to optimizing workflows — less technician downtime, better routing, and higher job completion rates. (Simpro 2025 Trades Outlook Report)
28. 94% of companies investing in FSM software see significant productivity gains and consistently meet KPIs. 83% of trade business respondents using FSM software say it has helped their company grow. (Simpro 2025 Trades Outlook Report; Simpro "Voice of the Trades" survey)
29. Roughly 68% of companies implementing comprehensive FSM software report higher productivity, while 72% report better first-time-fix rates. (Global Growth Insights)
30. More than 30% of trade business owners reduced costly emergency calls by implementing predictive maintenance capabilities, which prevented equipment failures. (Simpro 2025 Trades Outlook Report)
31. The average trade business manages at least five software systems, with larger operations running eight or more. Nearly one-third have no data-integration strategy. (Simpro 2025 Trades Outlook Report)
The operational fix: For businesses with $1 million+ revenue, the fragmentation problem creates margin leakage. Jobs get quoted in one system, scheduled in another, inventoried in a third, and invoiced in a fourth — creating four chances for errors and obscuring visibility into whether the job was actually profitable.
Related: Plumbing management tips from operators who run tighter businesses.
Smart Water, Sustainability, and Retrofit Statistics
Smart fixture installation is changing the economics of residential service calls. Contractors that can install and service connected systems will access a premium segment you can’t reach with standard break-fix work.
32. The global smart water management market is forecast to reach $50.7 billion by 2033, growing at a CAGR of 12.7%. North America holds a 34% share. (Grand View Research)
33. The smart bathroom market was estimated at $10.8 billion in 2024 and is projected to more than triple to $39 billion by 2035, growing at a CAGR of 13.7%. The smart faucet market alone is expected to grow by 67% from 2025 to 2030. (Future Market Insights; Grand View Research)
34. The tankless water heater market was valued at $4.86 billion in 2024, growing at a 6.6% CAGR through 2030. Hybrid heat pump water heaters are growing faster, at a CAGR of 18.52% through 2031. (Research and Markets; BDR)
35. Household leaks waste nearly 900 billion gallons of water annually nationwide. The average insurance claim for residential water damage or freezing is $13,954, creating urgency, not just upselling, for leak detection and prevention work. (Environmental Protection Agency; Insurify)
The operational fix: Can your technicians upsell a smart leak sensor during a repair call or quote a heat pump water-heater replacement during a service inspection? If so, they’ll generate higher average tickets from existing job flows. No additional headcount required.
Related: How to grow a plumbing business without proportionally growing overhead.
Customer Behavior and Marketing Statistics for Plumbing Businesses
The demand is there. Whether your business captures it depends on how fast you respond and what customers find when they search.
36. The search term "plumber near me" is searched over 135,000 times per month, making local search visibility a direct revenue lever. (Valve+Meter)
37. 54% of homeowners research and hire a plumber in under four hours. Many potential customers aren’t shopping around. They’re going with whoever picks up the phone. (Scorpion via Homepros)
38. 97% of local consumers look at online reviews before hiring a local business. 85% are encouraged by positive reviews; 77% are deterred by negative ones. (BrightLocal)
39. 59% of lead volume comes from referrals, while 88% of consumers most trust personal recommendations, showing that customers expect great service — and will reward you for it. Nielsen)
The operational fix: Don’t underestimate speed. If 54% of homeowners make a hiring decision within four hours, a slow callback means you lose the job, regardless of your pricing.
Related: Marketing for plumbers: What actually drives inbound calls?
How Plumbing Businesses Can Prepare for 2026
The right response to this data depends on where your business sits today.
- If revenue per technician is below $150,000: Audit scheduling utilization first. Top performers hit 65–75% billable hours as a percentage of total hours. Below 60%, you're losing revenue you've already paid to generate.
- If gross margin is below 55%: Break out margins by service line before raising prices across the board. The problem is usually concentrated, such as new-construction labor, specific job types, or material costs on high-ticket installs.
- If you're running 5+ disconnected software systems: Integrating software only gets more difficult as you scale. Consolidating to a unified platform pays for itself in recovered admin hours and faster invoicing.
- If more than 20% of your technicians are near retirement age: You’re already at risk of lost institutional knowledge and constrained capacity. Start building documentation and retention systems — this is an urgent situation.
- If callbacks are slow or online booking doesn't exist: With 54% of homeowners hiring in under four hours, response speed is the first filter. Any friction between a homeowner's search and a confirmed appointment is a competitor's opportunity.
Related: Ready to level up your business? Learn more about plumbing service software for job management.
What the 2026 Plumbing Industry Outlook Means for Contractors
Demand is durable. That's not the problem.
The labor shortage isn't going away, material costs won't reverse, and the homeowners who search "plumber near me" still need a plumber. Will you capture that demand or lose it? The answer depends on your operations.
Businesses that track revenue per technician, run a unified software stack, and price to their actual job costs are running at 20–35% net margin. Businesses that don't are running at 2–8%. The gap isn't about talent or market access. It's about their infrastructure.
If your current software setup makes it difficult to see profitability by job, technician, or service line, that's a problem worth solving now.
Simpro is purpose-built for trade businesses managing that complexity: job costing, scheduling, dispatch, inventory, and invoicing in a single platform used by more than 24,000 businesses and 250,000+ users worldwide. Companies using Simpro report up to a 25% revenue increase and a 30% productivity boost.
Schedule a demo to see how Simpro can improve your plumbing operations as you scale.