
Field data lives on paper timesheets. Material costs live in last quarter's spreadsheet. Invoicing lives in a different system than job costing. By the time you know what a job actually costs, your HVAC profit margins are long gone.
Meanwhile, top-performing HVAC businesses know exactly what every job costs before the invoice goes out.
They've built a different kind of operation, one grounded in systems that make gross and net profit measurable at the individual job level, in real time, before the invoice goes out.
What Really Drives HVAC Company Profit Margins
You can't protect what you can't see.
Margin is the output of a connected system:
quote → schedule → labor → parts → invoice → cash.
Every handoff in that chain is an opportunity for cost to leak and profit to disappear.
If you treat margin solely like as a pricing problem, you'll keep fixing the wrong thing. You'll raise your markup from 50% to 60%. You'll add a fuel surcharge. You'll build more detailed estimates with tighter labor hours. And your net margin will stay stuck at 8% because the real problem is that you can't see what jobs actually cost until months after they close.
Blue Flame Heating Solutions lived this. They were running £6 million in yearly revenue across 28,000 HVAC jobs without being able to see what those jobs actually cost them. Job data lived in spreadsheets. Asset history lived somewhere else. Invoicing lived in a third system that didn't talk to the first two. They could calculate theoretical margins, but had no visibility into what was actually happening at the job level.
Once they centralized everything into a single connected system, they could see actual job costs in real time.
How to Calculate HVAC Profit Margins That Mean Something
The formulas aren't complicated. The hard part is making them mean something when your cost data comes in three weeks late.
Gross vs. Net: Two Numbers, Two Different Diagnoses
Gross margin measures what you keep after direct job costs, including labor and materials. If you quote a residential HVAC replacement at $12,000 and your direct costs are $6,000, your gross margin is 50%. That $6,000 has to cover overhead, debt service, your salary, and whatever's left is net profit.
Net margin is what remains after you pay for everything else: office rent, admin salaries, insurance, utilities, truck payments, marketing. If overhead runs $4,500 on that same job, your net profit is $1,500, which is a 12.5% net margin.
But these numbers only work if costs are captured cleanly at the job level. If field labor isn't tracked to specific work orders, you're guessing at COGS. If materials get pulled from van stock without logging them, your job costs are fiction. In HVAC, field labor sits above the line as cost of goods sold. Every unbilled hour, every forgotten callback, every scope change that went undocumented is directly eating your gross margin. It won't show up as overhead creep. It shows up as gross margins that are 8 points lower than your estimates with no clear reason why.
The operational fix: Set one charting rule for how labor costs and materials get assigned to jobs, and enforce job closeout before invoicing. No exceptions. No "we'll fix it next month."
Markup vs. Margin: Why the Math Looks Right and the Numbers Don't
Most HVAC owners know the difference between markup and margin in theory. A 50% markup on a $400 part brings it to $600. A 50% gross margin means you keep $300 of every $600 you bill. The confusion is that these are not the same number. A 50% markup produces a 33% gross margin, not 50%. When that mix-up compounds across hundreds of jobs, it looks like a pricing problem. It's a data problem.
Top performers price HVAC services with live data, not vibes. They know what the condenser costs and what labor runs on changeouts because they track it job by job and feed it back into estimating. If you can't answer "what did that job actually cost us?" within 24 hours of completion, your pricing — no matter how carefully you researched it — is fictional.
The operational fix: Stop using static spreadsheets for pricing. Maintain updated vendor catalogs in your HVAC software. Use estimated vs. actual reporting to refine job templates after every close.
Where HVAC Profit Margins Actually Disappear
You know the margins you're supposed to hit. The problem is getting there consistently when cost leaks between quote and cash in places you can't see until it's too late.
Job Costing Leaks: Labor, Materials, and Change Work
Labor estimated at 6 hours that ran 9 with nobody logging the extra 3 until payroll ran two weeks later. A $40 filter grabbed from van stock that never made it onto the invoice. An extra zone damper added mid-install for $380 in parts and labor that never got billed because nobody documented it as a change. Individually, each one stings. Across hundreds of HVAC jobs a month, they're the difference between 12% net margin and 6%.
Chillmech Services dealt with this at scale. Running a 45-person commercial and industrial HVAC operation on paper timesheets, critical job data lived in filing cabinets. Field techs called the office to get asset history. By the time labor hours made it from paper to accounting, jobs were closed, invoices were out, and the actual cost was invisible. They couldn't see overruns while jobs were still open so there was no mechanism to catch them before money was already lost.
The operational fix: Add a pre-invoice reconciliation step. Before any invoice goes out, review estimated vs. actual for labor and materials. If the job ran over, you absorb it and update the template, or bill the overage as a change order if scope expanded. But you don't send an invoice without looking.
Operational Drag That Inflates COGS and Overhead Costs
Every hour a tech spends driving unnecessary miles, waiting for parts, or calling the office for information is an hour that isn't generating revenue.
Service calls that turn into callbacks send techs back out at pure cost. Routing built in a spreadsheet puts techs 40 miles apart when they could be 10. Parts not in van stock trigger a phone chain that burns 45 minutes of non-billable time on a job you already priced. Techs without mobile access to job history route every customer service question through the office, adding friction to every single visit.
One signal to watch is your admin-to-tech ratio. Successful HVAC companies run close to 1 admin per 10 field techs because field staff has direct access to the HVAC apps and data they need. If you're running three office staff for every 10 techs, you've got a structural overhead problem and you're paying people to manage information gaps that shouldn't exist.
The operational fix: Enable field-initiated procurement. If a tech needs a part, they should be able to order it from their phone. Eliminate the call-the-office-and-wait loop entirely.
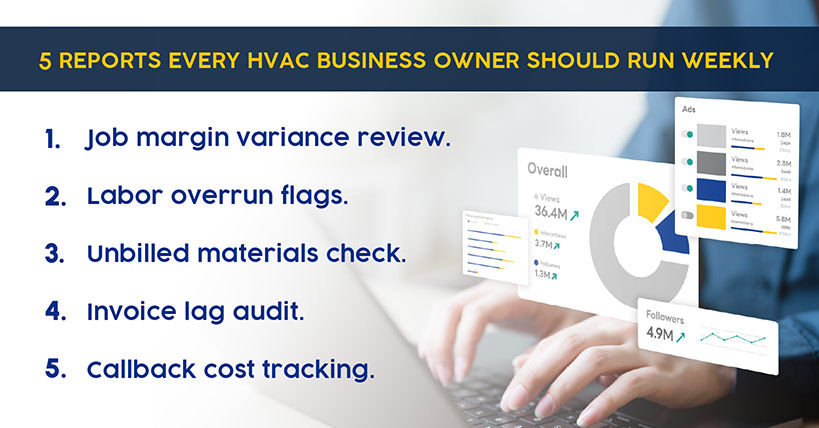
5 Reports Every HVAC Business Owner Can Run Weekly
Top performers don't wait for month-end reports to know if they're profitable. They run a simple operating cadence that catches margin leaks in real time before invoices go out, before cash flow suffers, before profitability becomes a surprise.
-
Job margin variance review. Pull a report of all jobs closed in the last seven days. Compare estimated margin to actual margin. Flag anything that ran more than 10% under estimate. If a job was quoted at 52% gross and ran at 41%, someone needs to know why. Was it a labor overrun? Material cost increase? Scope creep? Unbilled change work? Learn from it and adjust the next estimate.
-
Labor overrun flags. Review all open jobs where actual labor hours exceed estimated hours by more than 20%. If a job was estimated at 12 hours and the tech has already logged 15 with work still remaining, that's a margin problem in progress. Either adjust the scope, bill a change order, or accept the loss. But don't let it surprise you at invoicing.
-
Unbilled materials check. Run a report of materials issued to jobs in the last seven days that haven't been invoiced yet. If parts left the warehouse or van stock but aren't on any work order, that's margin leaking in real time. Assign them to jobs or write them off, but don't let them disappear.
-
Invoice lag audit. Identify any jobs that closed more than 48 hours ago but haven't been invoiced yet. Every day of delay is a day your cash flow suffers. If jobs are consistently sitting in "pending invoice" status, you've got a process bottleneck. Fix it.
-
Callback cost tracking. Track how many callbacks happened in the last seven days and what they cost. Not just the count — the cost. If you sent three techs back out to fix issues from last week's jobs, that's three truck rolls and 6+ labor hours of pure cost with zero revenue. If callback cost is running above 2% of weekly revenue, you've got a quality or training problem that's eating margin (and eroding customer satisfaction).
This cadence takes 30 minutes a week. It catches margin leaks before they compound. And it turns margin from a lagging indicator (something you discover after the fact) into a leading indicator (something you control in real time).
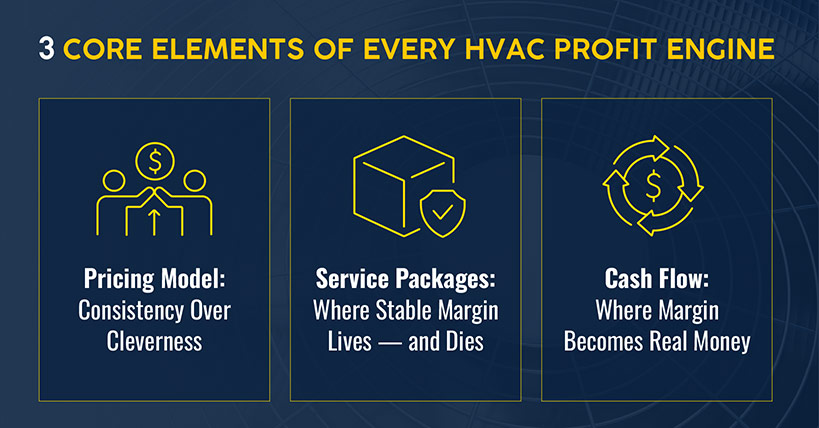
The HVAC Profit Engine: Build It, Then Benchmark It
The average profit margin for an HVAC company sits between 10–20% net. Three things determine whether you hit it: how you price, how you sell recurring work, and how fast cash moves.
Pricing Model: Consistency Over Cleverness
The pricing model you choose matters less than whether you can execute it consistently across every tech, every estimate, every job type.
Flat rate pricing works when HVAC jobs are predictable and you have clean historical cost data. It breaks on custom commercial work where every job has different site conditions. Time and materials pricing works when scope is uncertain, but only protects margin if labor hours are captured accurately and materials are marked up consistently. Good-better-best pricing lifts average ticket value but that model only works if estimators can build those options quickly without inventing numbers on the spot.
What great looks like: Gross margin of 50–55% across closed jobs. Below 50% and you've likely got one of three problems: estimating is off; job costing is broken and actual costs are higher than estimates but invisible until after invoicing; or jobs are consistently running over on labor with no one updating the templates.
The operational fix: Pull estimated vs. actual reports for closed jobs on a regular cadence. If certain job types consistently run over, update the template. Pricing strategies should be dynamic.
Service Packages: Where Stable Margin Lives — and Dies
Maintenance agreements are supposed to stabilize profit by providing shoulder-season work, predictable cash flow, and higher customer lifetime value. But they only protect margin when fulfillment and billing are automated. Manual scheduling, missed renewals, billing lag, and low renewal rates eat the margin you built the agreements to protect.
John Williams Heating Services ran into this directly. Managing care plan agreements was consuming 10+ hours of admin time per month, including scheduling, invoicing, follow-ups and renewals. After automating recurring jobs, recurring invoices, and renewal reminders, that load dropped to near zero. Invoices went out immediately after service completion. Customers could pay online. Margin on those agreements improved because the overhead cost to fulfill them dropped.
Keep a close eye out for blended margins, which can hide which work is actually funding the business. A blended gross margin of 52% might look healthy until you break it out and see residential service running at 62% and commercial installation running at 38%. The service work is quietly subsidizing the installation work. You won't know until you segment.
What great looks like: Service and repair typically runs 55–65% gross thanks to labor-driven, smaller jobs and tighter scope. Replacement and installation runs 45–55% as material costs take a bigger share of revenue. New construction and commercial projects run 35–50% due to competitive bidding, longer timelines, and higher overrun risk. If maintenance agreements aren't clearing 55%, look at fulfillment cost first. Automation is usually the lever.
The operational fix: Automate recurring job scheduling so service visits generate without manual effort. Build divisional scorecards that break out revenue, gross margin, and net margin by job type. If one division is consistently underperforming, you have the data to decide whether to fix pricing, adjust staffing, or shift where you focus.
Cash Flow: Where Margin Becomes Real Money
Margin is only real when it turns into cash. Billing lag, disconnected accounting, and slow payment collection are the three bottlenecks that consistently kill cash flow, and each one compounds the others.
Blue Flame called it "the invoicing black hole." Jobs would close, invoices would get lost in the handoff between field and accounting, and cash flow suffered because revenue recognition lagged by weeks. Once they integrated job management with accounting, invoices flowed automatically from completed jobs into the accounting system. No manual export, no lost invoices, no month-end reconciliation disaster.
What great looks like: Net margin of 10–20% for top performers. Below 10% usually means overhead is bloated, collections are slow, or both. Overhead should run 25–35% of total revenue. HVAC contractors using mobile payment collection report invoice-to-payment time under 24 hours. That's the difference between financing your customers and running a business with predictable cash.
The operational fix: Offer pay-now options in the field. Give customers the ability to pay by card or ACH immediately after service. The faster cash moves, the more accurately your revenue reflects the work you've actually done.
Your Margin Is In There. Go Find It.
You now know what the leaks look like. The question is whether you can properly manage them day to day.
That's what Simpro® is built to help you do. You get one platform connecting estimating, field operations, procurement, and cash flow so you're not just watching margin more closely, you're building the kind of operation that doesn't hemorrhage it in the first place.
Ready to run a more stable, profitable HVAC business? Schedule a demo and see what's possible when your numbers finally tell the truth.