
Knowing the key electrical industry statistics of 2026 helps you understand what the industry really looks like in 2026 — and where it's going. For example, you might have heard that the U.S. electrical market size is $347.5 billion, but most roundups don’t explain what that means for a contractor running a shop with revenue of $2 million to $10 million.
Keep reading for 30 data points that matter to operators: today’s margins, what the labor crunch looks like in real terms, what’s driving demand, and what compensation looks like for the people you're trying to hire and keep. We’re giving you context, not just figures.
Electrical Industry Statistics 2026: Key Takeaways
Before getting into the full breakdown, here are the key data points that shape everything else:
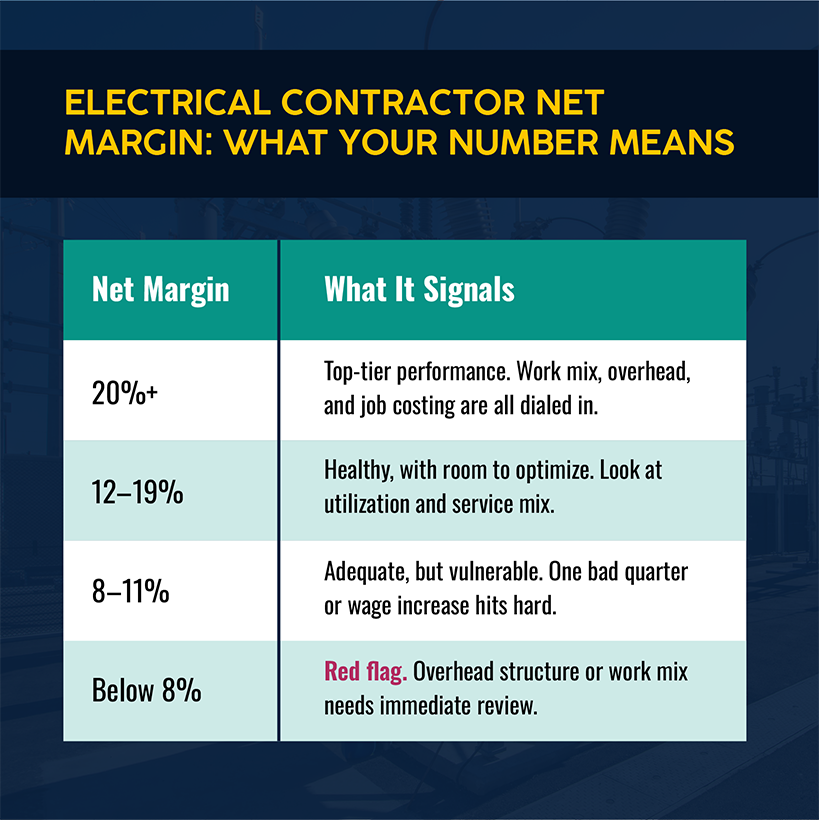
- The U.S. electrical industry is projected to reach $347.5 billion in revenue in 2026, but average net margins sit at roughly 7.5%. That spread reflects how much revenue gets absorbed by labor, materials, and overhead before it becomes profit.
- There are currently 81,000 electrician positions opening up in the U.S. each year, with projections for the workforce to shrink 14% by 2030 because of retirements and turnover.
- The top 50 U.S. electrical contractors collectively posted a record $59.5 billion in revenue in 2025, which signals concentration at the top end of the market — and how much white space still exists for regional operators.
- U.S. data center construction spending is running at an annualized $50.7 billion pace, up 28.1% year over year. Electrical work accounts for 45–70% of total data center construction cost.
- Top-performing electrical contractors run 20%+ net margins, or roughly 3x the average. The difference isn't about volume, but margin discipline, work mix, and job-costing visibility.
Electrical Industry Market Size and Revenue Statistics
The market numbers make it clear that the demand is there. The harder question for most contractors is whether their operations are positioned to capture it profitably.
1. The U.S. electrical industry is projected to reach $347.5 billion in revenue in 2026
That represents a CAGR of 4.8% over the past five years, with 2026 growth estimated at 0.7% because of macroeconomic headwinds.
Source: IBISWorld
2. There are approximately 262,000 electrician businesses in the U.S. in 2026
The industry has grown at a 3.2% CAGR since 2021. The vast majority of these businesses generate under $2 million in annual revenue, meaning the competitive landscape is heavily fragmented at the lower end.
Source: IBISWorld; Northeastern Advisors
3. The top 50 electrical contractors posted a record $59.5 billion in combined revenue in 2025
Meaningful market share is concentrated in a small group of national players. Those figures reflect how much consolidation has already happened at the top. For regional contractors, this data point illustrates the ceiling and provides an argument for professionalization.
Source: Facility Solutions Group
4. Future growth is projected to slow to roughly 2.4% per year
Historical growth averages about 3.7% annually. The deceleration reflects macroeconomic normalization after a period of exceptional construction activity. Contractors who grew fast through the high-growth years should test whether their cost structures are built for a lower-growth environment.
Source: Northeastern Advisors
5. New construction accounts for 36.6% of electrical contractor revenue; maintenance/service/repair represents 35.7%; modernization/retrofit covers 28%
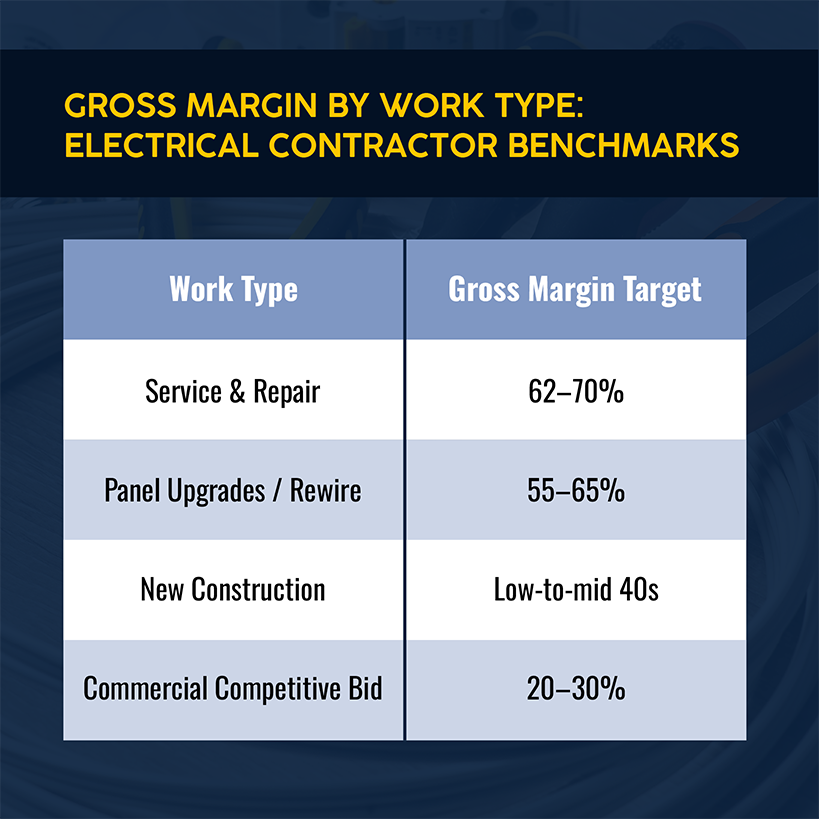
The near-even split between new construction and service/repair is worth noting. Service work typically runs significantly higher gross margins than new-construction bid work. Most financially disciplined contractors are shifting accordingly.
Source: Electrical Contractor Magazine
Related: Our electrical business profit guide gives you a deeper breakdown of gross margin by work type, overhead targets, and utilization benchmarks.
Electrician Employment and Workforce Statistics
Demand for electricians is outpacing supply. These numbers show the scale of the gap and what it costs operators who don't adapt.
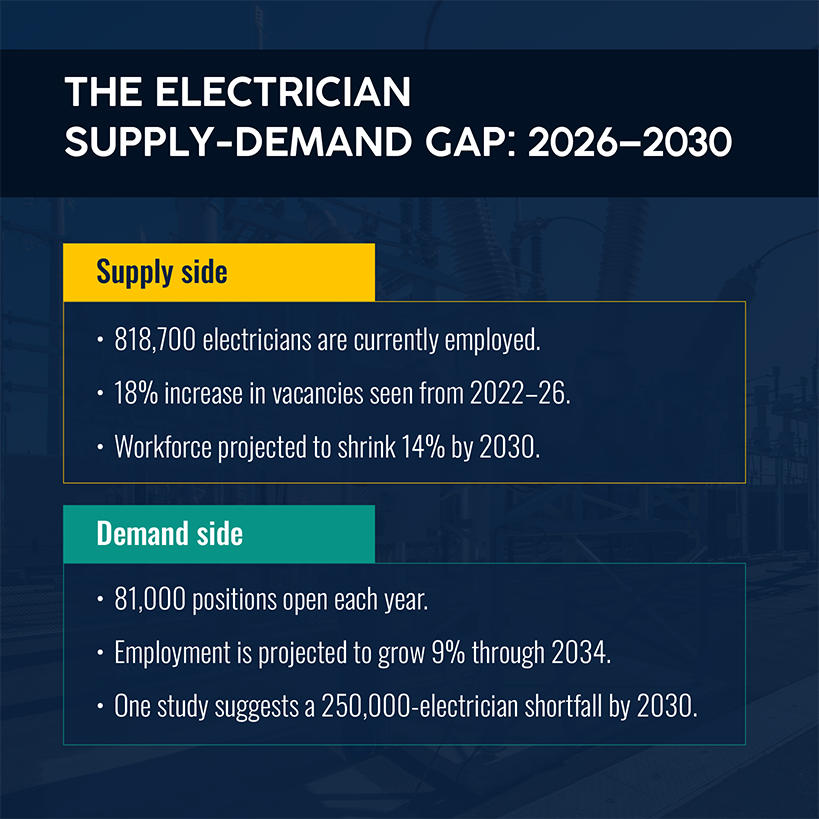
6. There are currently 818,700 electricians employed in the United States
This industry has grown rapidly in the past 15 years, from a low of roughly 542,000 workers in 2011.
Source: Bureau of Labor Statistics; FRED (Federal Reserve Bank of St. Louis)
7. Electrician employment is projected to grow 9% from 2024 to 2034, classified as "much faster than average"
The BLS projects approximately 81,000 openings per year over the decade. That figure includes replacement demand as experienced electricians retire.
Source: BLS
8. Demand for skilled trades jobs is growing 3x faster than for professional desk-based roles
That's based on an analysis of more than 150 million U.S. job postings from 2022–2026. The trades shortage isn't a local phenomenon. It's structural.
Source: Randstad, via Trade Colleges
9. Electrician vacancies increased by 18% from 2022–2026
For context, HVAC engineers saw 78% vacancy growth, and robotics technician vacancies increased 113%. Electrician demand is rising, but the physical infrastructure buildout is pushing related specialties even harder.
Source: Randstad, via Trade Colleges
10. Electrical contractors with 10+ employees continue to grow, with 47% adding staff in the most recent survey year
Only 16% of these larger shops decreased headcount, which means they’re pulling away from small shops.
Contractors that build systems for recruiting, scheduling, and retaining technicians are outpacing those still relying on informal hiring.
Source: Electrical Contractor Magazine
Related: Check out electrical marketing strategies that are working for contractors right now.
Electrical Labor Shortage and Skills Gap Statistics
The labor shortage numbers are frequently cited, but businesses don’t always hear about the operational costs. Losing a trained technician affects scheduling and pricing power, not just the cost of recruitment and onboarding.
11. Expect 81,000 electrician job openings to post each year through 2034
This emerging demand will likely make the labor shortage worse, especially amid retirements and other turnover. One study predicted in 2020 that the U.S. could face a shortage of over 250,000 electricians by 2030.
Source: BLS; Klein Tools and The Accelerate Group
12. Nearly 30% of union electricians are near retirement age
This isn’t just bad for data center construction; it’s also a problem for any electrical contractor seeking to grow their business amid a shrinking workforce and accelerating retirements.
Source: Fortune
13. The electrical workforce is projected to shrink by 14% by 2030, even as demand could increase by 25%
That's a 39-point gap between projected supply and demand. The technicians you have will be more valuable in 2030 than they are today.
Source: Electrical Contractor Magazine
14. The construction industry needs 349,000 net-new worker positions in 2026 alone
More than 530,000 skilled trade positions sit unfilled across all trades. Electrical is competing for a shrinking labor pool alongside every other mechanical trade.
Source: Associated Builders and Contractors
15. Optimizing technician utilization from 65% to 75% adds 10+ billable hours per tech per month
At $95–$105 per billable hour, that's roughly $1,000–$1,050 per tech per month in additional recoverable revenue without adding a single hire. With the labor market this tight, that math is worth running on every truck in your fleet.
Related: Learn how electrical job management software from Simpro® helps you track utilization, reduce drive time, and maximize billable hours across your entire field team.
Electrician Wages and Earnings Statistics
Compensation is rising across the board. These benchmarks matter for three reasons: hiring competitiveness, overhead modeling, and retention planning.
16. The electrical contracting sector pays roughly $85.1 billion annually in wages
That’s a collective number across more than 250,000 companies in the U.S.
Source: Northeastern Advisors
17. The median annual wage for electricians was $62,350 as of May 2024
BLS also provides mean annual and hourly wage levels, based on the percentile. The bottom 10% average $42,640; the midrange is $63,190; and at the 90th percentile, senior electricians earn $100,000+.
18. Oregon is the top-paying state for electricians, with a median of $101,310
No other state offers a six-figure median wage. Illinois, Hawaii, and Washington are the next three, each offering a median wage of over $95,000.
Source: BLS
19. Electricians specializing in data center work can earn $200,000+ annually
Not a typo. The demand for qualified electricians — and other trade workers — on hyperscale data center projects has accelerated specialty compensation.
Source: Wall Street Journal
20. Electrician business owners typically earn $65,000–$150,000 annually; successful larger operations can break $200,000
Owner compensation varies widely based on business size, market, and how well the operation runs without the owner on every job.
Source: Lightning Path Partners
Electricity Demand and Power Sector Statistics
The demand side of the electrical industry is being reshaped by three forces: AI infrastructure buildout, electric vehicle (EV) adoption, and grid modernization. Each one generates work, but the timeline and distribution across contractor sizes vary considerably.
21. U.S. power consumption is forecast to hit record highs in 2026 and 2027
U.S. energy demand already set a record in 2025, and the Energy Information Administration predicts new records this year and next — as much as 4,379 billion kilowatt-hours in 2027, thanks to AI data center load growth and increasing demand for electricity in the residential and commercial sectors.
Rising demand for energy across sectors is fueling the electrical industry's growth outlook despite macro headwinds.
Source: Reuters, citing EIA
22. The U.S. smart grid market is expected to reach $22 billion by 2029
Smart grid upgrades (substations, distribution modernization, advanced metering infrastructure) require electrical contractors with experience in high-voltage power systems and complex distribution work. These projects create a lasting pipeline for contractors that bid on utility and municipal contracts.
Source: The Business Research Company
23. The smart home device market is projected to reach $116.4 billion by 2029
Panel upgrades, EV charger installations, whole-home automation, and smart lighting retrofits are residential work categories with strong margins. For service-oriented electrical contractors, the continued growth of home electrification and energy-efficiency upgrades presents opportunities for recurring revenue.
Source: The Business Research Company
24. Renewables accounted for 93% of U.S. capacity additions through September 2025
Solar and storage comprised 83% of the renewables total. Electrical contractors that offer solar installation, battery energy storage integration, and grid interconnection are positioned for a buildout wave. The opportunities include utility-scale power-generation projects and distributed residential systems.
Source: Deloitte 2026 Renewable Energy Outlook
25. 28% of electrical contractors are working on EV charging installation, up from 24% in 2022
The federal 30C tax credit covers up to 30% of electric vehicle EV charger and installation costs for qualifying residential and commercial installations. The adoption trends are clear, even if that particular credit is sunsetting.
Source: Electrical Contractor Magazine; Plug In America
Data Center, AI, and Infrastructure Statistics
No other demand driver is reshaping electrical contracting faster than data center construction. These numbers explain why, along with the opportunities for contractors that aren't building hyperscale facilities.
26. U.S. data center construction spending is at an annual run rate of $50.7 billion
This figure from April 2026 shows data center construction spending up 28.1% over the past year, versus a 0.3% gain for the broader nonresidential sector.
The lesson? If you’re not in data centers, growth is flat.
Source: Associated Builders and Contractors
27. Electrical work accounts for 45–70% of total data center construction cost
Every data center needs power infrastructure: switchgear, UPS systems, backup generation, high-density cabling, and complex electrical system design spanning high-voltage switchgear to low-voltage distribution.
Electrical contractors represent the largest single cost category on these projects.
Source: IBEW
28. Hyperscalers are trending toward $725–$800 billion in 2026 capex for infrastructure
Amazon, Microsoft, Google, Oracle and Meta are collectively deploying capital at an unprecedented pace.
Every tier of electrical contractor is entering the pipeline, from prime contractors to regional subcontractors supporting mechanical, electrical, and civil work.
Source: CNBC, citing BNP Paribas and Evercore ISI
29. Power infrastructure spending is projected at $27.8 billion in 2026, up from $16.5 billion in 2025
That's 68% year-over-year growth in transmission and distribution infrastructure. This is grid-level work that supports data center power delivery, electrical generation capacity expansion, and the power systems modernization required to handle rising electrification load.
Rising energy costs are pushing utilities to accelerate this timeline in many cases.
Source: ConstructConnect
30. The FSM software market serving specialty trades is valued at $5.66 billion in 2025, growing to $9.87 billion by 2031
Despite this growth, the electrical contracting segment continues to operate largely on paper, phone calls, and PDFs.
Contractors still running manual operations at volume will lose out to competitors who adopt field service management (FSM) platforms.
Source: Mordor Intelligence
How Electrical Contractors Can Prepare for 2026
These data points don't exist in isolation. They stack. It starts with labor shortages that cut into technician availability and rising wages. Then, maybe you haven’t updated flat-rate structures. Next, it’s margin compression from commercial bid work, which combines with invoicing delays that slow cash flow.
Each problem on its own is manageable. Together, they're what separates contractors running 7.5% margins from those running 20%.
The contractors that close the gap do the following:
- Track revenue per technician monthly, not quarterly. The NECA benchmark is $180,000–$250,000 per journeyman per year. A tech dropping from $22,000/month to $15,000/month deserves a look within 30 days, not at the year-end P&L.
- Shift the work mix toward service and repair. Service and repair gross margins target 65–70%. Residential new-construction bid work runs 25–30%. A dollar of residential service revenue is worth roughly twice as much in gross profit as a dollar of commercial bid revenue.
- Run job costing on every project. Estimated margin and actual margin diverge on project work. By closing that loop, you get more accurate data and protect your margins over time.
- Schedule with precision. 65% utilization is no longer ideal. To grow your electrical business, aim for at least 75%.
Related: Learn how to run a successful electrical business, including the systems that separate high-margin operations from average ones.
The Demand Is There. So Is the Margin Pressure.
These 30 electrical industry statistics underscore the underlying tension: Demand for electrical work is strong, but so are the obstacles of structural pressures, labor costs and availability, commodity pricing, and operational complexity.
The contractors who will run 20% margins in this environment aren't chasing the most revenue. They simply know their numbers, manage their work mix, and create the operational visibility to act on what those numbers are telling them.
Can your job management system reveal a job’s true margin before you invoice, or display your utilization rate without a manual spreadsheet pull? If not, that’s the first gap to close.
Simpro gives electrical contractors the job costing, scheduling, dispatch, and reporting tools built specifically for the trades, not adapted from generic SMB software. Over 24,000 businesses use it to move from average margins to top-tier performance.
Schedule a demo to see how Simpro connects the numbers that run your business.