
Picture a payroll report listing 11 technicians, while the dispatch board shows only seven techs who completed jobs. That difference matters when setting a revenue-per-tech benchmark. Calculating by payroll data rather than field conditions will reduce your revenue per technician by more than one-third.
That gap affects more than just reporting: Revenue per technician is one of the first numbers owners check when deciding whether to hire. At 11 technicians, the crew has room to spare and is potentially underproductive. At seven, the same crew looks maxed out.
As a metric, revenue per technician is most helpful when the denominator is field technicians, the people who run jobs. Counted right, it reveals a contractor’s operational efficiency, how much field work converts to billed revenue, and whether the next hire will improve output or merely increase payroll.
Keep reading to learn how to calculate revenue per technician, what this key performance indicator (KPI) says about your business, and how to improve it without forcing techs to sell more.
What Is Revenue per Technician?
Revenue per technician is the revenue your business bills over a period divided by the number of revenue-producing field technicians who worked. For trade services companies between $1 million and $20 million in revenue, this KPI ties hiring to growth.
Just as important is deciding who doesn’t count as a revenue-producing technician, such as office staff, many managers, and trainees who only ride along. For edge cases, like service managers who sometimes run calls, set guidelines for how to classify them, and apply them the same way every period.
How to Calculate Revenue per Technician
Use one formula and keep your inputs identical from month to month:
Revenue per technician = revenue for the period ÷ average full-time-equivalent (FTE) technicians in that period
FTE converts partial availability into whole-person terms, so a technician who worked half the period counts as 0.5. Averaging across the period keeps a mid-month hire or departure from skewing the result.
Go further than that basic formula by doing the following:
- Pull total revenue billed over the last 12 months. A rolling 12-month window keeps the summer rush and the winter lull from distorting the figure.
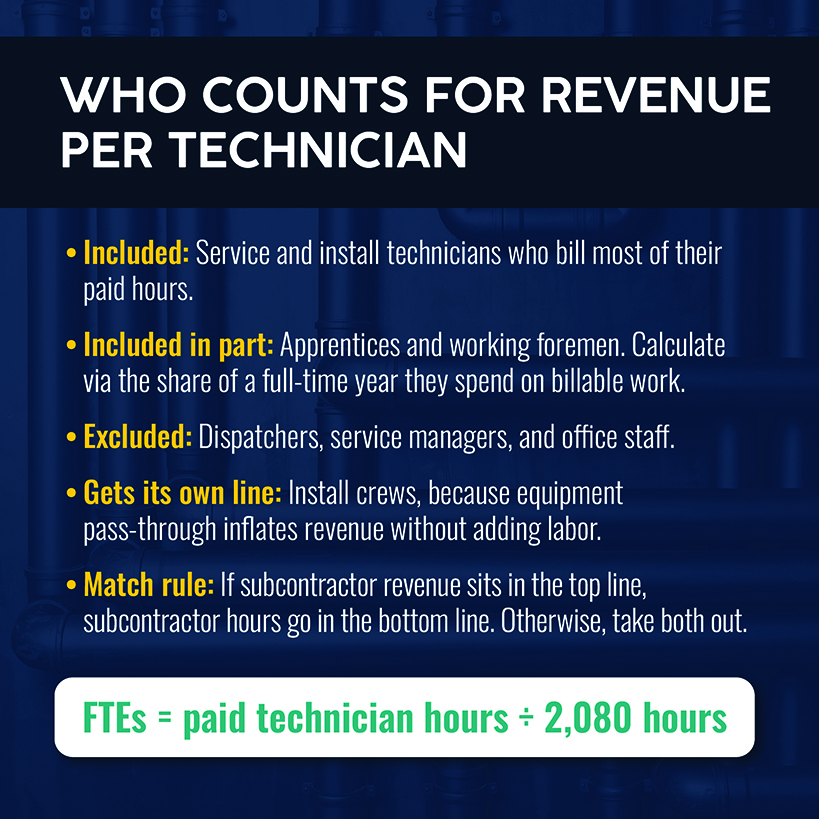
- Convert technicians to FTEs by dividing paid technician hours by the hours in a full-time year (typically 2,080). A technician who started in July counts as half.
- Divide revenue by FTEs.
- Annualize anything shorter than 12 months before comparing it to a benchmark.
Let’s say your plumbing shop billed $2.7 million total, with 7.5 FTEs — seven full-time technicians and one half-time apprentice. That’s $360,000 per technician. If you round up to 8.0 FTEs, you’d get $337,500, a gap that widens whenever you bring in seasonal or part-time hires.
Who you count matters almost as much as the math. Revenue per field technician should only include the people whose hours you bill. In other words, don’t include dispatchers, office staff, or service managers who don’t run jobs.
In addition, count service crews and install crews separately. Each has its own business model, and installs carry large equipment pass-through that inflates revenue without adding labor.
What Is a Good Revenue per Technician Benchmark?
Published industry benchmarks vary widely. One of the most respected and traceable sources is CFMA's 2025 Construction Financial Benchmarker, built on financial statements from 1,558 contractors. Of those, 42% were specialty trades, with the largest segments consisting of plumbing, heating, air conditioning, and electrical contractors.
Here’s what the CFMA data reveals about specialty trades:
| Specialty trade contractors, FY2024 | CFMA result |
|---|---|
| Revenue per FTE | $320,661 |
| Gross profit per FTE | $68,929 |
| Gross profit margin | 22.4% |
| Net income before taxes, all firms | 7.7% |
| Net income before taxes, under $10M revenue | 6.5% |
| Net income before taxes, $10M to $24.9M revenue | 8.0% |
| Net income before taxes, top quartile | 14.2% |
Your revenue per technician could be even higher, as CFMA reports per FTE, which can include office staff and other personnel. Furthermore, CFMA states that its respondents aren’t meant to be “a statistically valid representation of the construction industry as a whole.”
Over time, you’ll develop a benchmark that reflects your business. But if your field-only average is less than the CFMA’s $320,661, take a look at utilization and scheduling before anything else.
What Revenue per Technician Can Tell You About Your Business
Revenue per technician works best alongside other key metrics. Set it against headcount and gross profit, for example, to isolate problems that don’t stand out on a revenue report. Here are a few examples of the patterns that emerge:
Higher revenue, lower profit. Revenue per technician increases for two consecutive quarters at your plumbing shop. Your crew has started replacing water heaters at a thin-margin, flat-rate price, with the equipment cost passing through the invoice. The revenue number looks like a win, but gross profit per technician is declining.
New hires temporarily drag down revenue. Let’s say you then add three HVAC technicians in March. New hires ramp slowly, with senior techs billing fewer hours of their own while onboarding them. As a result, revenue per technician falls further by summer. The shortfall is in your training and scheduling — and additional hires make it worse.
Performance is steady, but the backlog increases. For a full year, revenue per technician is flat, gross profit per technician holds steady, and your electrical backlog keeps growing. Your crew's full. That's a capacity ceiling, and your choices are to raise prices or hire someone.
The operational fix: Report on these figures each month, by trade and by work type. Get specific, because a blended gross profit per technician hides which division is actually thriving.
Related: See how scheduling gaps, weak fleet visibility, and slow office-to-field communication play out across field service operations.
How to Increase Revenue per Technician Without Simply Asking Techs to Sell More
Revenue per technician is the product of two things: how many hours a technician bills and how much revenue each billed hour brings in.
Imagine two full-time technicians, one who bills five hours each workday while the other bills 6.5 hours. The extra billable time comes from the work around the work. Tighter scheduling reduces drive time and gaps, while better job prep means a technician knows the job’s history, details, and parts — reducing the likelihood of a return trip. And each billed hour is worth more when jobs are properly priced to cover labor, materials, and overhead.
None of these levers requires setting new sales targets or asking technicians to bring a hard sell.
Increase Billable Technician Utilization
Billable utilization is billed hours divided by paid hours.
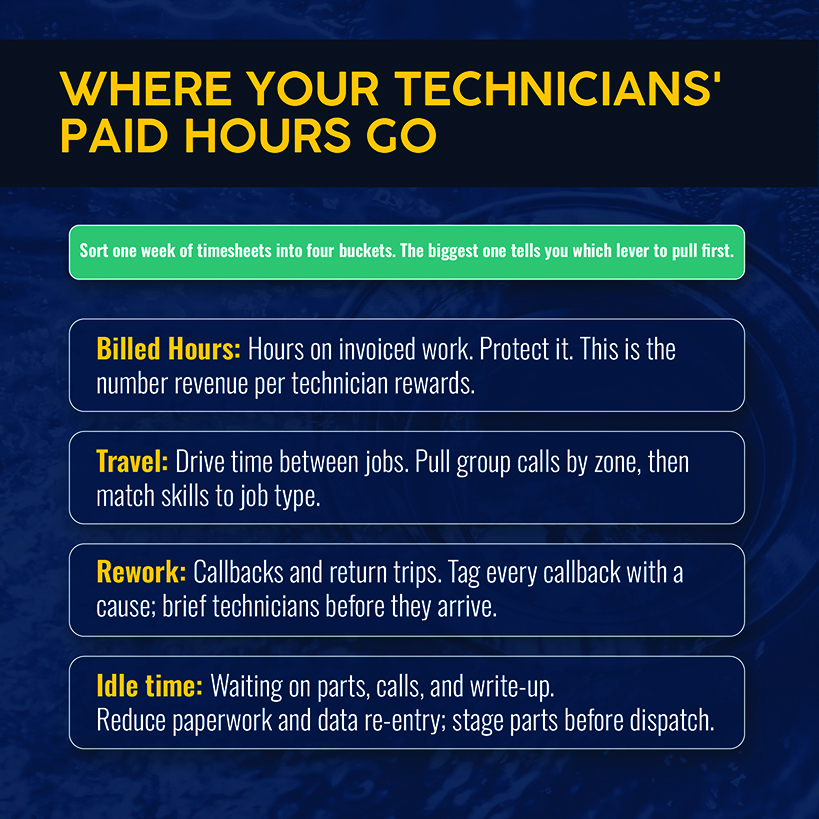
A full-time technician who bills 26 hours per week is at 65% utilization, with the other 14 hours going to drive time, waiting on parts, callbacks, paperwork, or idle time.
Find the unbilled hours before you try to recover them. Sort one week of timesheets into billed, travel, rework, and idle time. From there, you can isolate the weak spots.
The financial impact is significant: At a $140 billing rate, adding one more billable hour per day across a 10-technician crew adds about $350,000 over a full working year (250 working days) — without adding customers.
Related: See how AI can help improve technician utilization by deciding which service calls get scheduled first.
Reduce Drive Time and Improve Scheduling
Drive time shows up on the dispatch board before it shows up on the P&L. Send a technician to a 9 a.m. job in one neighborhood and a 10:30 job across town, and they’ll spend more of the morning in the van than on the job. By grouping calls by zone and matching skills to job type, you can recover those hours without adding a truck.
Kiely Plumbing moved scheduling, dispatch, and customer communication onto Simpro®, reporting 63% less admin time on those tasks and a 25% increase in daily hours billed per technician.
Increase Average Job Value Through Better Pricing and Job Mix
Your average ticket size determines what each billable hour is worth. Consider two 90-minute HVAC visits, each requiring one technician and one truck. One ends in a $189 diagnostic fee with no repair. The other ends in a $640 capacitor and contactor replacement. Revenue per technician credits the second visit with more than three times the revenue for identical hours.
To improve average job value, start by checking your flat-rate prices against current parts and labor costs. Then, set minimum charges that cover the drive, and track average revenue and gross profit per labor hour by job type. Finally, steer the schedule toward those jobs, with maintenance agreements as the steady base. No technician has to pitch anything. All they have to do is finish the work on the first visit, especially for higher-value jobs.
Improve First-Time Fix Rates and Reduce Callbacks
A callback adds the cost of a second truck, but without additional revenue. Track your first-time fix rate and callbacks as a share of completed jobs, by technician, and by job type. Tag each callback with a cause, whether that’s a missing part, missing site history, skill gap, or customer-side issue.
Simpro's JobReady agent can brief a technician before they head out, pulling from job history, technician skills, and required materials.
Give Technicians the Information and Training They Need
New hires pull your crew’s average down during onboarding, while every ride-along pulls a senior technician's billable hours down with them. You can speed up onboarding with accessible equipment histories and documentation on how to perform the most common jobs.
Simpro's FieldReady agent guides new technicians through business processes and system setup, which reduces the training workload on the senior techs who bill the most.
Reduce Administrative Work in the Field
Paper forms, re-keyed notes, and end-of-day timesheets rebuilt from memory turn billable hours into overhead. Just 30 minutes of write-up per technician per day can cost tens of thousands per year.
Simpro's JobScribe captures job documentation while the technician works, and GPS Time Tracking prompts technicians when they arrive and leave so hours are recorded in real time.
Related: Read our guide to accurate technician time tracking in the field.
Revenue per Technician Doesn’t Equal Profit per Technician
Many people assume revenue per technician is the KPI that shows whether your team is profitable. The table above shows the distance between the two: for specialty trades, CFMA’s gross profit per FTE is about one-fifth of revenue per FTE.
The gap has more than one cause, but one reason is that costs accrue on paid hours, while revenue accrues only on billed hours. Across the construction industry, employer costs averaged $51.96 an hour in June 2026 in wages and salaries plus benefits — and that doesn’t count the costs of the truck, tools, training, and nonbillable time.
What's left is thin. According to CFMA, specialty trade contractors kept 7.7 cents of net income before taxes on each revenue dollar. Shops under $10 million in revenue kept only 6.5 cents.
The operational fix: Review per-technician revenue and gross profit together. High revenue with a small gross profit can point to discounted installs or heavy equipment pass-through. High revenue with healthy gross profit points to a capacity ceiling and a possible need to hire. Low revenue with healthy gross profit points to an underused crew and a need to recheck scheduling.
Use Revenue per Technician to Make Better Hiring and Capacity Decisions
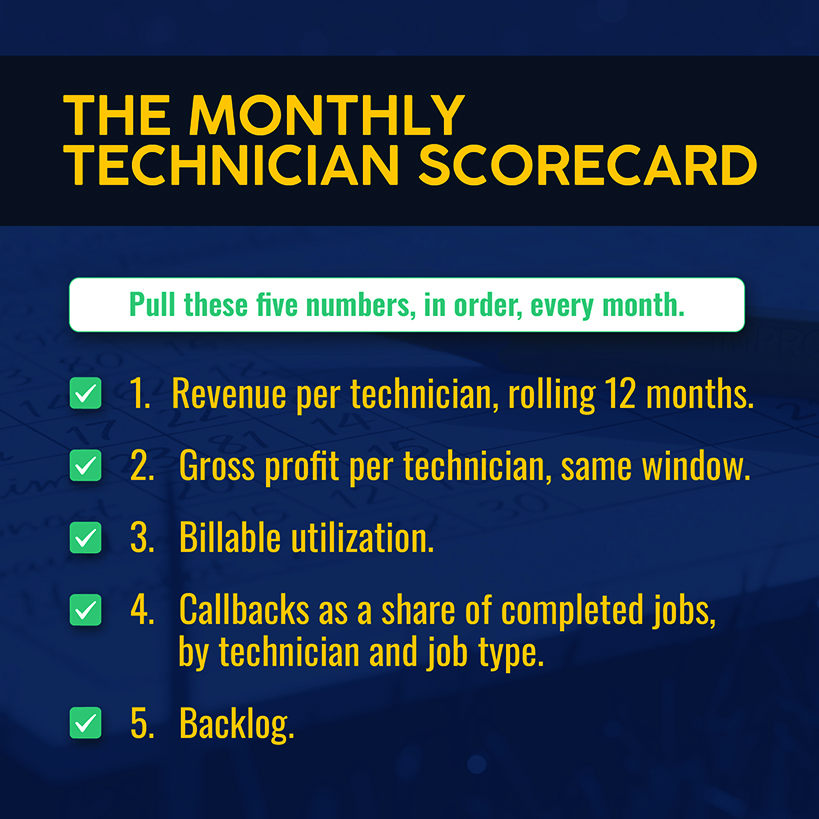
The patterns above eventually lead to a decision point: Hire, fix the operation, or raise prices. Before deciding, check these figures:
- Revenue per technician against its own best level
- Gross profit per technician
- Backlog
If revenue per technician is near-peak, gross profit per technician holds, and the backlog keeps growing, your crew is full, and a hire will likely add output.
If revenue per technician falls while headcount rises, look at scheduling, onboarding, and job mix before compounding the problem with another hire.
Keep in mind that the labor market is tight, with an aging trades workforce that complicates hiring and retention. Replacing retired or departed workers could be a significant challenge, much less recruiting skilled workers beyond that.
Related: See how trade leaders get more done without hiring by fixing scheduling errors, dispatch bottlenecks, and capacity planning.
Turn Revenue per Technician Into an Actionable KPI With Simpro
For many contractors, the inputs live in different places: Revenue in the books, hours on timesheets, job cost in a spreadsheet that gets manually updated. To track revenue per technician in real time and act on it quickly, you need a system that connects all your data.
Simpro is purpose-built for the trades, and it ties billed revenue, labor hours, and job costs to the same jobs. Its reporting library includes 70+ reports, among them Job Productivity and Profit and Loss by Job. Scheduled reports can land in your inbox daily, weekly, or monthly.
JustAsk, the plain-language assistant in Simpro Lightning, answers questions such as margins by technician from the data already in the platform. For a figure built around your business’ definition of a technician, Simpro's Professional Services team can build custom reports at an added cost.
Simpro supports over 250,000 users worldwide. The goal for every one of those crews is the same: Bill more of the hours you pay for and keep more of what you bill. Schedule a demo to see how Simpro reports against your own job data.
Frequently Asked Questions About Revenue per Technician
What is revenue per technician?
Revenue per technician is billed revenue divided by the average number of full-time-equivalent field technicians. This formula can help you judge crew output and identify when it’s time to hire.
How do you calculate revenue per technician?
Pick a time period. Divide billed revenue by the average number of full-time-equivalent (FTE) technicians over that period. Build FTEs from paid technician hours, rather than overall headcount.
What is a good revenue per tech benchmark?
CFMA's FY2024 data puts specialty trade contractors at $320,661 in revenue per FTE and $68,929 in gross profit per FTE. Those figures are per employee, so a field-only count might come out higher. Your company’s trends over time can give you an even better sense.
Should installers count as technicians when calculating revenue per technician?
Count installers whose hours you bill, but report them on a separate line from service technicians. Install revenue includes large equipment pass-through, and blending that with service revenue distorts both crews.
How often should you track revenue per technician?
Review it monthly on a rolling 12-month basis. The window smooths seasonality, and a monthly cadence catches a falling trend while you can still adjust scheduling or job mix.
Does higher revenue per technician mean higher profitability?
Not on its own. Heavy discounting or equipment pass-through can raise revenue per technician while profit stays flat, so make sure you also track gross profit per technician.


 Back to top