
Plumbing business KPIs often don't get much attention until a bad month forces the question. Revenue looks fine, the schedule is full, and then payroll is tight — and nobody can explain why. The answer is almost always hiding in the numbers you weren't watching: job-level margins, technician utilization, first-time fix rates.
The companies that scale without constant cash flow anxiety aren't necessarily running more calls. They know exactly which metrics drive profit, and they review them every week.
What Are Plumbing KPIs and Why Do They Matter?
A key performance indicator (KPI) is a measurable value tied directly to a business goal. For example, your first-time fix rate is a KPI because it tells you whether your team is solving problems efficiently or bleeding money on callbacks.
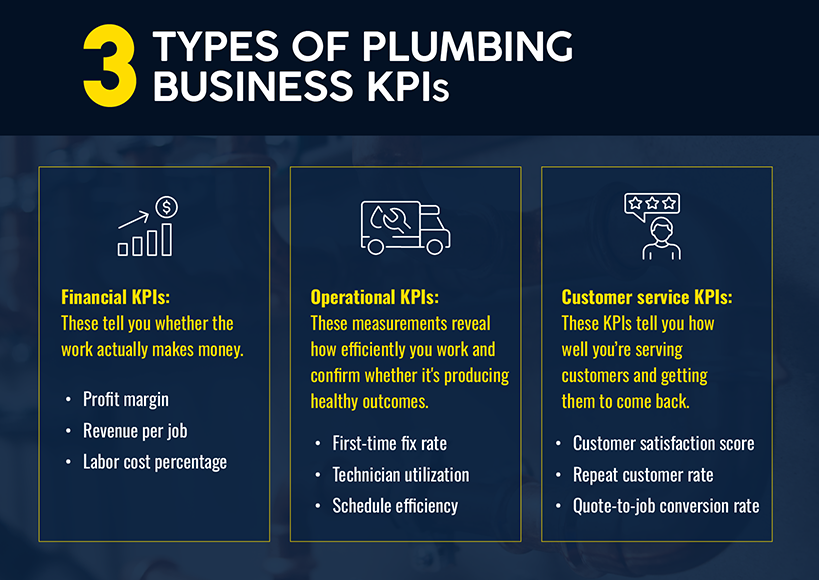
KPIs for plumbing contractors fall into three categories.
- Financial KPIs: Profit margin, revenue per job, labor cost percentage. These tell you whether the work is actually making money.
- Operational KPIs: First-time fix rate, technician utilization, schedule efficiency. These measurements reveal how efficiently that work gets done.
- Customer service KPIs: Customer satisfaction score, repeat customer rate, quote-to-job conversion rate. These KPIs tell you how well you’re serving customers and getting them to come back.
Annually calculating your operating costs isn’t enough. If you want to get the most out of KPIs, you should know your top three off the top of your head — including daily, weekly, and monthly numbers.
Financial KPIs Every Plumbing Services Business Should Track
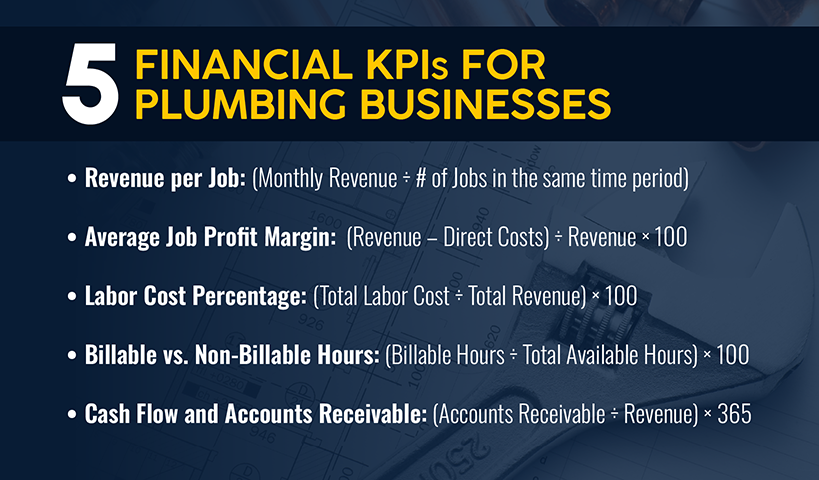
Revenue per Job
The formula: (Monthly Revenue ÷ # of Jobs in the same time period).
Average ticket size is one of the clearest indicators of job-level performance.
Successful residential plumbing operations maintain average ticket sizes of $300 to $500, while commercial jobs typically land between $800 and $1,500 per call.
Revenue per technician matters just as much. Top performers generate $200,000 to $300,000 in annual revenue per tech.
Why do average tickets decline? It’s usually about rushed diagnostics, weak option presentation, or pricing confidence issues. Not lack of demand.
The operational fix: Break down your average ticket (revenue per job) by technician. If two techs consistently average $280 while one averages $450, you've found a training opportunity. Use your plumbing software to track this at the job level.
Average Job Profit Margin
The formula: (Revenue – Direct Costs) ÷ Revenue × 100.
Gross profit margin tells you what’s left over after your direct costs (materials and labor).
Well-run plumbing businesses target gross margins between 60% and 70%, with 62%+ considered strong, according to plumbing profit margin benchmarks from over 200 company acquisitions.
Service and repair typically carries 60% to 68% gross profit, while drain cleaning and sewer work hits 65% to 75% when correctly pricing plumbing jobs. A blended 58% might look fine — until you realize your install division is lagging while service subsidizes the loss.
The operational fix: Track your margin monthly by department and job type. If any category drops below 50%, audit the last 10 jobs for material waste, mispriced labor, or scope creep.
Labor Cost Percentage
The formula: (Total Labor Cost ÷ Total Revenue) × 100.
Labor is typically the largest expense in a plumbing business — typically 30% to 50% of revenue.
Plumbing labor costs have been growing roughly 4% annually since 2019, with a national median wage of $30.27/hour, per BLS data. When your labor costs creep past 50% of revenue, profitability evaporates.
The operational fix: Monitor biweekly. If it's climbing, look at overtime patterns, callback frequency, and whether you're dispatching senior techs to jobs that apprentices could handle.
Billable vs. Non-Billable Hours
The formula: (Billable Hours ÷ Total Available Hours) × 100.
Billable utilization measures how much of a technician's paid time generates revenue. The top firms are at 75% to 85%. Average firms land at 60% to 70%. Below 55%? You’re in trouble.
Each 5% increase for a $100/hour technician adds roughly $10,400 in annual revenue.
The operational fix: Track travel and logistics time as a percentage of total hours. If techs spend 30%+ of their day in the truck, your routing needs attention.
Cash Flow and Accounts Receivable
The formula: (Accounts Receivable ÷ Revenue) × 365.
The metric to watch here is days sales outstanding (DSO). When DSO consistently exceeds your payment terms by 25% or more, you have a collections process problem.
The operational fix: Automate invoicing so it fires the same day the job is completed. For jobs over $1,000, collect 40%+ upfront. Maintain a 13-week rolling cash forecast, and set aside 10% of monthly profit as an operating reserve for slower periods.
Operational Plumbing KPIs That Drive Efficiency
First-Time Fix Rate
The formula: (Issues Resolved on First Visit ÷ Total Service Calls) × 100.
First-time fix rate measures whether calls were resolved on the initial visit. Here’s what to look for:
- Best-in-class organizations average 88%.
- Midtier companies land around 80%.
On average, each unresolved call requires an additional 1.6 dispatches at $200 to $300 per truck roll.
The operational fix: When your first-time fix rate drops, audit the returns. The common culprits include: incomplete truck stock, poor pre-call diagnosis, and mismatched tech skills.
Technician Utilization Rate
The formula: (Total Billable Hours ÷ Total Available Paid Hours) × 100.
Utilization measures billable hours against total paid hours. Here’s what to look for:
- The target for plumbing is 75%+.
- Top performers average 75% to 80%.
- The industry average sits at 55% to 60%.
The potential revenue impact is dramatic for business owners. Say you’re a 20-technician company at a $100/hour billable rate. When you improve utilization from 55% to 65%, you add roughly $1 million per year — without hiring anyone.
The operational fix: If utilization is below 65%, map each tech's day, hour by hour, for one week. Potential problems include: windshield time, callbacks, and jobs running twice as long as estimated.
Job Completion Time
The formula: (Total Time Spent on Jobs by Category ÷ Number of Jobs Completed by Category)
By tracking average completion time by job category, you can tighten estimates, identify training gaps, and schedule more precisely.
The operational fix: Compare times across technicians for the same job type. Large variances usually mean a need for training or a process worth standardizing.
Schedule Efficiency
The formula: (Jobs Completed Within Scheduled Time ÷ Total Scheduled Jobs) × 100.
Poorly managed schedules cost you twice: frustrated customers and underutilized technicians. Dispatch software with GPS tracking and route optimization can cut emergency response times by 50% or more while helping techs complete more jobs daily.
The operational fix: To identify shortcoming, track these metrics: jobs per technician per day, drive time as a percentage of total time, and same-day schedule changes.
Inventory and Material Usage
The formula: (Materials Tied to Work Orders ÷ Total Materials Pulled from Vehicles) × 100.
Every fitting, valve, and fixture pulled from a truck should be tracked and tied to a work order. Otherwise, you face job delays from missing parts. Your margins erode from untracked costs. And your cash is tied up in dead stock.
The operational fix: Set minimum stock levels for high-use items, and assign inventory by van. If you've outgrown your plumbing CRM, this is usually one of the first places it shows up.
Customer Service Plumbing Business KPIs That Measure Success
Customer Satisfaction Score
The formula: (Satisfied Customers ÷ Total Respondents) × 100.
Customer satisfaction score (CSAT) measures happiness with a specific interaction, typically through a post-service survey. A good score ranges from 70% to 85%.
The operational fix: Get a fuller picture of how your customers feel by also tracking Net Promoter Score (NPS). CSAT tells you about the last job, while NPS tells you if they'd recommend you to someone else.
Repeat Customer Rate
The formula: (Returning Customers ÷ Total Customers) × 100.
The best plumbing companies see 40% to 60% of customers return within two years.
Retention pays off: Acquiring a new customer costs five times more than retaining one. The probability of selling to an existing customer is 60% to 70%, compared with just 5% to 20% for new prospects.
The operational fix: If your repeat customer rate is below 30%, audit your post-job follow-up process. Stay top of mind with automated check-ins at six months and 12 months, and tie them to maintenance agreements.
Response Time to Service Calls
The formula: (Time from Call Receipt to Technician Arrival ÷ Total Service Calls).
Businesses miss anywhere from 25% to 60% of inbound calls during business hours. That represents massive amounts of potential revenue lost.
Emergency calls should be answered within minutes, with techs arriving within 60 to 90 minutes.
Non-emergency appointments: within 24–48 hours.
The operational fix: Make sure you’re tracking missed calls and arrival time, so you can address each challenge without confusing them.
Quote-to-Job Conversion Rate
The formula: (Quotes Accepted ÷ Total Quotes Sent) × 100.
Plumbing leads convert at 12 to 16% overall, or roughly double the home services average. Conversions for emergency calls can reach 80%. Overall, well-run companies convert 60% to 80% of qualified leads.
The operational fix: When conversion drops, look at pricing transparency, response speed, and how your team handles the initial call.
Online Reviews and Reputation Metrics
The formula: (Sum of Ratings Stars ÷ Total Number of Reviews).
89% of customers read reviews before choosing a service provider. Your goal should be maintaining an average rating of 4.5+ stars on Google.
The operational fix: Send automated review requests after each job. This will increase the volume of reviews received, which directly improves local SEO rankings and Google Map Pack visibility.
Growth KPIs for Scaling a Plumbing Business
Lead Conversion Rate
The formula: (Leads That Became Paying Customers ÷ Total Leads) × 100.
Beyond quote-to-job numbers, track how efficiently marketing turns into paying customers.
Phone leads dominate, with 46% closing on the first call. High-intent inbound leads convert at 15% to 30%, while outbound averages just 2% to 8%.
The operational fix: If you're not tracking leads by source, start there. Make sure you’ve optimized your processes for handling inbound calls.
Cost per Lead
The formula: (Total Marketing Spend ÷ Total Leads Generated).
Plumbing marketing typically generates leads for $30 to $98 each, with an industry average of $53. Note that the full cost of customer acquisition can run from $100 to $300.
The operational fix: Track your cost per lead by channel. This eliminates waste and doubles down on what converts.
Revenue Growth Rate
The formula: ((Current Period Revenue − Prior Period Revenue) ÷ Prior Period Revenue) × 100.
The U.S. plumbing industry has been growing at roughly 3.1% annually, with total revenue estimated at $191.4 billion in 2026, according to IBISWorld.
The operational fix: If you're growing slower than the industry average, you're losing market share even if revenue is up.
Service Agreement Growth
The formula: (Customers with Service Agreements ÷ Total Active Customers) × 100.
Service agreements transform a break-fix business into predictable revenue.
Mature providers aim for penetration above 40%. Below 20% signals heavy reliance on unpredictable emergency work.
The operational fix: For strategies on building recurring revenue, see our guide on how to grow a plumbing business.
Technician Productivity Trends
The formula: (Total Revenue ÷ Number of Technicians).
One crucial way to map your technicians’ productivity is to track revenue per technician. Do this monthly. Additionally, track tech-generated leads — additional work identified on-site — as an indicator of inspection quality and communication skills.
The operational fix: Low or uneven numbers usually point to dispatching issues, poor job mix, or callbacks.
How Plumbing Software Helps Track Plumbing Business KPIs
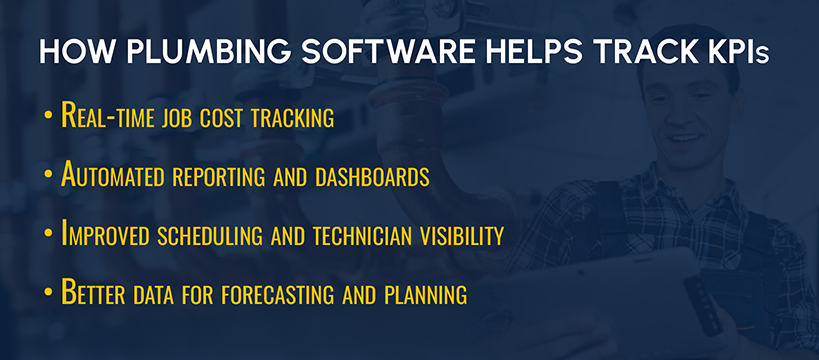
You can’t pull KPIs for plumbing contractors from spreadsheets, at least not at scale.
You need field service management software that captures most metrics automatically, including job times, revenue, and material usage — all without giving your techs more admin work.
The right software platform gives you:
- Real-time dashboards that flag out-of-range metrics
- Smart dispatching based on skill and GPS proximity
- Financial reporting that connects job data to your P\&L
Companies using route optimization have reported up to 20% more customer visits per week. In addition, tracking seasonal trends lets you optimize your staffing and marketing instead of reacting to cash-flow surprises.
Using Plumbing KPIs to Build a Stronger Business
Most owners already know something is off before they start pulling numbers. The margin that should be there isn't. A tech who should be your most productive isn't tracking that way. A job type that felt profitable is quietly dragging the average down. The KPIs in this article give you the framework to stop guessing at which problem to fix first.
Start with one financial, one operational, and one customer-facing metric. Build a weekly review habit around them. Then add more as the data starts driving decisions rather than just confirming them.
Simpro® gives 24,000+ trade businesses the real-time visibility to stop guessing and start managing by the numbers — from job-level profitability to technician utilization and service agreement tracking.
Ready to run your plumbing business on data instead of instinct? Schedule a demo, and see how it works for your operation.