
TL;DR
- Split every gap by cost line (hours from rate, price from quantity) before you assign blame.
- A job type that keeps missing in one direction points to the estimate. A miss largely generated by one crew, site or project manager points to execution.
- A miss inside the accuracy range for scope definition is a normal spread. A miss outside the range needs a cause.
- Review variance weekly on open jobs, and price every scope change before the work starts.
In the skilled trades, determining the reasons for project job cost variance depends on who you ask. Ask your estimator why jobs go over budget, and they’ll say it’s the crew. Ask the project manager, and it's the supplier's second delivery. The crew lead will blame the drawings because they didn’t show the curb adapter.
On a $42,000 rooftop unit retrofit that was quoted at 31% gross margin but closed at 19%, all three people could be right. The job cost report doesn’t say which, however. It only reports the $5,040 gap between the margin you priced and the margin you kept.
That $5,040 comes out of your bottom line. Considering the 7.7% pretax net income averaged by specialty trade contractors in CFMA's 2025 Benchmarker, you’ll need roughly $65,000 of new revenue to overcome that margin gap. But you can't recover margin until you know where it went.
Keep reading to learn how to split the gap by labor, materials, subcontractors, and other costs, then sort each piece into an estimate error or an execution error. From there, fix estimate errors in labor units and the price book. Execution errors get fixed in scheduling and field data.
How to Analyze Job Cost Variance and Find Where the Margin Went
There are six sources to work through, listed in order of how fast you can check them. The first three come straight off the job cost report. The last three usually require digging through timesheets, change orders and historical data.
Labor Hours and Labor Cost Variance
A labor overrun hides two different problems behind one number:
- Hours variance means your crew spent more time than the estimate allowed.
- Rate variance means each hour costs more than you priced it — whether because of overtime, a senior tech on a journeyman's task, or a jump in the overhead costs loaded into your burden rate.
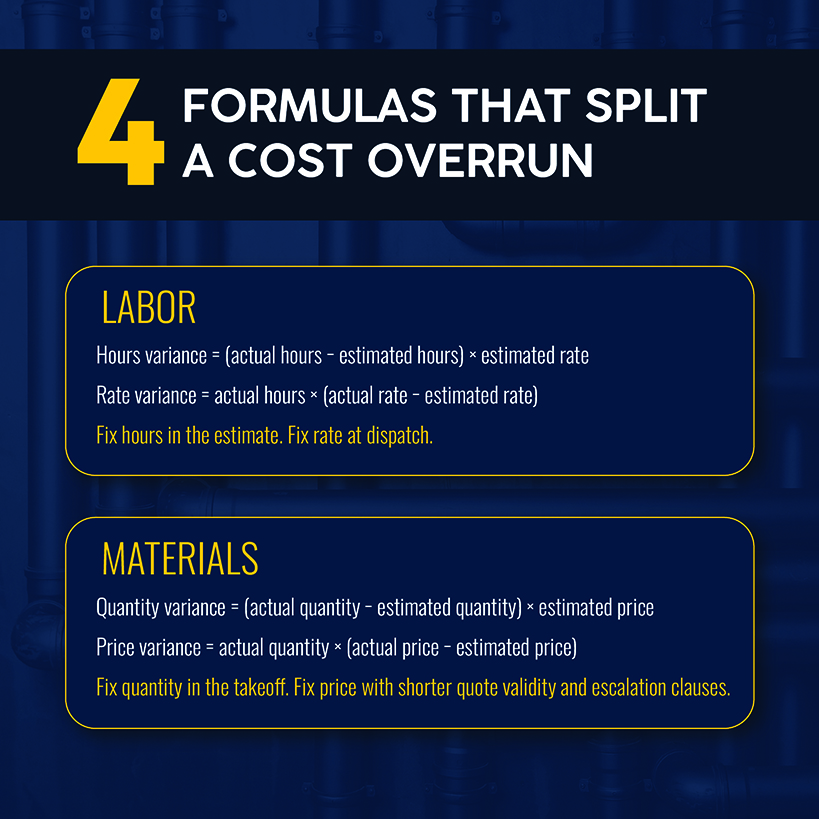
For example, a panel upgrade gets estimated at 24 hours at a standard cost of $62 per burdened hour, or $1,488. It closes at 30 hours and $71 per burdened hour for a total cost of $2,130.
That’s $372 of hours variance (six extra hours at $62 each) plus $270 of rate variance (30 hours at $9 more per hour) for a total gap of $642.
Hours variance points to the labor unit or the site conditions. Rate variance points to who you sent and when.
The operational fix: Track hours and rate variance separately on every labor line. Check hours first, because a problem here compounds across jobs. Rate variances trace back to dispatch decisions you can fix tomorrow. An hours problem that repeats on the same job type often means the estimate carries the wrong labor unit.
Material Price and Quantity Variance
Materials also have two types of variance:
- Price variance mostly comes from the market. You can manage but not control it.
- Quantity variance often results from takeoff errors and waste. You can control this.
Producer prices for nonferrous metals, which include copper and aluminum, are up 33.0% over the 12 months to August 2026, according to the Bureau of Labor Statistics. If a quote on metal-heavy work sits open for a few months, pricing can easily go stale.
Consider this example: A repair is estimated at 180 feet of 3/4-inch copper at $7.40 a foot, or $1,332. The crew buys 205 feet at $8.70, or $1,783.50.
That’s $185 of quantity variance (25 extra feet at $7.40) and $266.50 of price variance (205 feet at $1.30 more per foot) for a total gap of $451.50.
The operational fix: Shorten quote validity on metal-heavy work, and add an escalation clause for materials pricing. For the quantity side, compare the takeoff to what the crew pulled; write down where the extra went — cut waste, a reroute, damaged lengths, or something else.
Related: Simpro® lays out how trade businesses can protect revenue and margins with AI, regardless of material costs.
Subcontractor and External Cost Variance
Vendor invoices add a timing problem to projects. Subcontractors, rentals, and disposal fees often hit your books weeks after the work is complete, so variance here tends to show up at closeout.
Consider a trenching subcontract estimated at $4,800. The invoice lands at $5,900 because of a $600 rock surcharge, plus $500 for a second mobilization because the utility locate came back late. That $1,100 gap has two causes:
- The surcharge results from an estimate assumption that didn’t pan out.
- The second mobilization often traces back to scheduling.
The operational fix: Ask each subcontractor for a written quote before they make changes. Reconcile their final invoice to the original quote line by line, recording the cause of each difference.
Scope Changes and Missed Change Orders
Some changes never get invoiced, like unpriced extra work. Adding two circuits on a tenant improvement job, for example, can cost you hundreds of dollars each in labor and materials, and you absorb it all without a change order. Even worse, unpriced work or changes that aren’t logged promptly show up as unexplained labor overruns.
Even documented change orders can erode productivity and margin. A 2012 study of 226 mostly large construction projects found productivity beat plan on 60% of projects where change stayed under 5%. Once change passed 20%, productivity never reached plan.
The operational fix: Project managers should write down changes on the same day they’re requested, pricing them before anyone picks up a tool. Account for both the change’s hours and how it affects the rest of the schedule.
Related: Verbal approvals and unlogged labor overruns are two of the hidden margin killers for trades businesses.
Rework, Callbacks, and Return Visits
Rework costs you twice: once for the original labor, and again for the fix. A 2009 analysis of 359 Construction Industry Institute projects found that direct rework averaged about 5% of construction cost on owner-reported projects and about 2% on contractor-reported ones. Design errors, design changes, and owner changes drove rework, not crews.
The service work equivalent is the callback. For example, a water heater install requiring a return trip can cost you over $700, assuming a $210 part and two techs spending 3.5 hours each at $71 an hour. That erases nearly all of the margin you’d expect from the install.
The operational fix: Charge each return visit to the original job and tag a cause (missed scope, wrong part, workmanship, etc.). The wrong part points to ordering or truck stock. Workmanship issues suggest problems with field training or quality checks.
Job Costing and Data Capture Errors
Some project cost overruns result from bookkeeping. Weak time tracking puts hours on the wrong job; material pulled from truck stock can get charged to a different job; supplier invoices might arrive after closeout. Each creates variance.
Let’s go back to that $42,000 retrofit: If $1,900 of fittings are billed to the job next door, this job's margin shifts by about 4.5 points, and the neighboring job moves in the other direction.
Profit projections tend to be optimistic. An analysis found that, across thousands of audited financial statements, the profit projected on work-in-progress (WIP) reports exceeded final profit on completed projects by just over 1%. If your jobs lose margin between the halfway point and the final invoice, check your financial data for late cost capture before blaming the crew.
The operational fix: Before you treat a number as a variance, check timesheets for hours coded to the wrong job, truck stock pulls charged to the right job, and supplier invoices not yet posted. If the number still holds, the variance is real. Compare it to the estimate, line by line, and carry what you learn into the next bid.
Related: Learn how to protect job margins and how Simpro Lightning makes this easier.
Estimate vs. Actual Job Costing: What Should You Compare?
Use the six sources to decide where to look, then run estimate vs. actual job costing, line by line. If you’re tracking costs as a total, you can’t see which lines are leaking margin.
| Line | Estimate Side | Actual Side | Variance(s) to Calculate |
|---|---|---|---|
| Labor | Hours × burdened rate, by task | Timesheet hours × actual burdened rate | Hours variance and rate variance |
| Materials | Takeoff quantity × quoted price | Quantity pulled and bought × invoice price | Quantity variance and price variance |
| Subcontractors and vendors | Written quote or vendor price | Final invoice, including any changes | Invoiced minus quoted, by change |
| Equipment and rentals | Days planned × daily rate | Days on rent × daily rate | Duration variance and rate variance |
| Change orders | Price of approved additions | Cost of extra hours and materials spent | Unbilled or underpriced work |
| Revenue and margin | Estimated gross margin | (Final revenue — actual cost) ÷ final revenue | Margin points lost, by cost line |
Use the same cost codes on both sides. For a mid-job check, borrow the vocabulary from federal cost control practice. The Government Accountability Office's cost guide defines cost variance as earned value — actual cost, where earned value is the budgeted cost of the work done so far.
A negative number means you spent more than that work was worth. Divide earned value by actual cost to get the cost performance index (CPI); anything below 1.0 means the job is over budget for the work completed.
Suppose your project budgeting lists $21,000 of finished work against spending of $23,500. Your cost variance is –$2,500, and the CPI is 0.89. That tells you spending is outpacing production, but you can still change staffing or purchasing.
CFMA's 2025 Benchmarker puts specialty trade gross profit at 22.4% overall. A job that misses its estimated margin by 5 points gives up more than 20% of typical gross profit.
Related: Simpro's rundown of KPIs that protect margin shows how to track each one.
How to Tell Whether the Estimate or the Job Execution Caused the Variance
To determine whether a variance came from the estimate or the job, look at patterns across jobs of the same type. Those patterns include:
- One job type repeatedly missing in one direction. The labor units or assumptions behind that estimate are off.
- One crew, site, or project manager driving the miss. Look at scheduling, supervision, and how that crew captures time.
A third result points to no cause: a miss inside the expected cost range. To size that range, use AACE International's estimate classification for building and general construction projects, which pairs how much of the scope was defined with a typical accuracy range. An estimate priced at roughly 10%-40% defined can range from 5%-15% under to 10%-20% over. At roughly 65%-100% defined, the band narrows to 3%-5% under and 3%-10% over.
Use these ranges as a rough shape for your project estimates. As a rule of thumb: The less the job is defined when you price it, the wider the miss you should expect. Inside that band, a miss is normal spread. Outside it, find the cause.
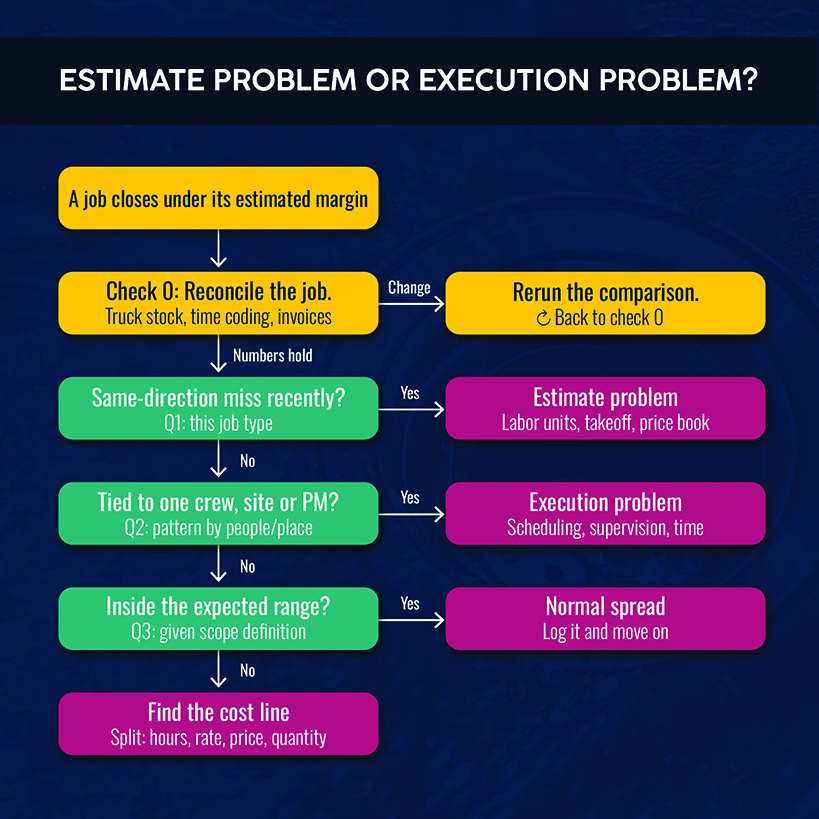
The operational fix: Do this type of review each week. Quarterly reviews arrive too late for currently open jobs.
Build a Consistent Job Cost Variance Review Process
A post-mortem explains one job. Turning it into a routine helps you spot patterns and prevent margin surprises. Build it in this order:
- Cost and estimate on the same codes. Every estimate line needs a matching job line, so you’re not guessing.
- Run job cost variance analysis weekly on open jobs. Consider a size cutoff for small service calls.
- Split every variance. Hours from rate, price from quantity.
- Log each scope change the day it’s requested. Price it before work begins.
- Reconcile truck stock and supplier invoices to jobs. Do this before declaring a variance.
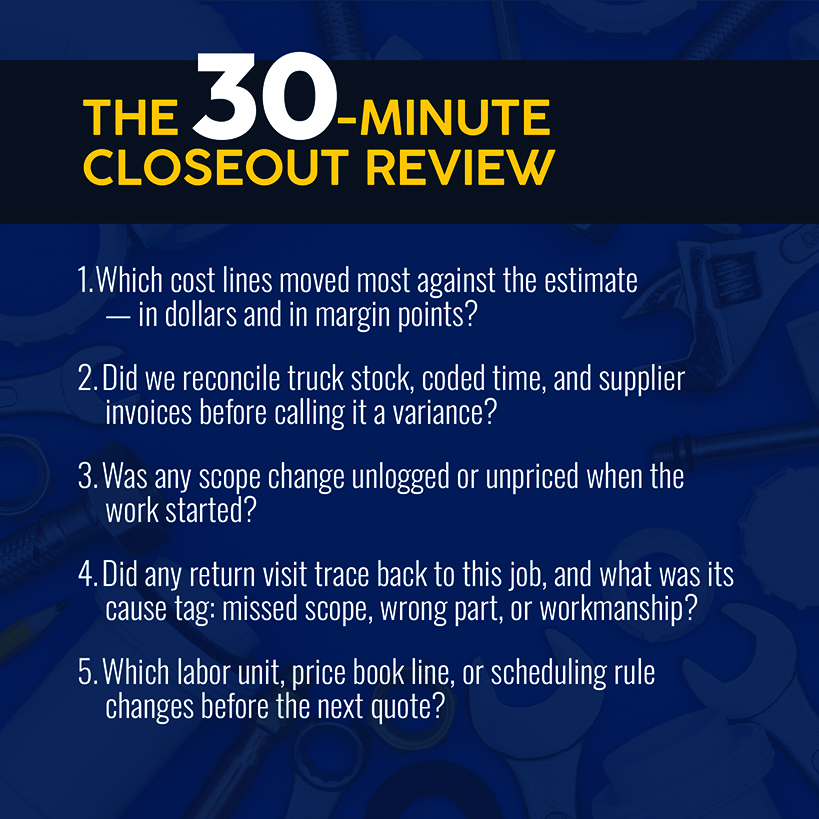
- Hold a short closeout review on jobs that finish 3+ margin points under estimated margin. A margin-point threshold flags the same relative miss on a $4,000 service upgrade and a $400,000 project. A closeout review has to change something, so end it by naming the labor unit, price book line, or scheduling rule you'll edit.
See Job Costs and Margin Changes Earlier With Simpro
Many of these steps rely on actual costs landing on the right job while it's still open. But you can’t do that if labor and material live in separate systems. With Simpro, job costing ties back to the estimate and to field-entered materials.
Simpro Premium lets you manage billable and non-billable parts, labor, contractors, and equipment on the job, so you can track project margin as work moves. Labor reports show job costs per employee, and the Schedule Comparison report sets each team member's actual results against the scheduled timeframe. Simpro Lightning is AI-powered, and JustAsk answers plain-language questions such as margins by technician.
More than 250,000 users in trade and field service businesses trust Simpro. Blue Wave Communications ran into the data capture problem directly. One year, it wrote off around $18,000 in inventory that should have been billed to customers. After adopting Simpro, inventory write-offs shrank to less than $500. Company leaders can open a job, view open purchase orders, and see where costs might vary before problems grow.
See how Simpro tracks job costs against your estimates and keeps the margin you priced in view. Schedule a demo.


 Back to top
