
Shrinking profit margin can seem like a mystery, especially when revenue is up and you're attracting new customers. The right electrical business KPIs reveal your true profitability, where you're bleeding margin, and how to improve efficiencies.
Most electrical businesses have a revenue number they're proud of. But they sometimes struggle to understand why profit keeps shrinking, even as work keeps coming in. By tracking KPIs for electrical companies, you can close that gap and help your business thrive.
Why Electrical Business KPIs Matter Now
Labor costs are rising. Material prices remain unpredictable. And residential and commercial customers alike are increasingly price-sensitive, even as the scope of work gets more complex.
Revenue distribution across the industry reflects this pressure:
- Roughly 37% of electrical contractor revenue comes from new construction.
- 36% comes from maintenance, service, and repair work.
- 28% from modernization and retrofit projects.
Each of those segments operates on different margin profiles, cash flow timelines, and risk exposures. A blended revenue number obscures those differences.
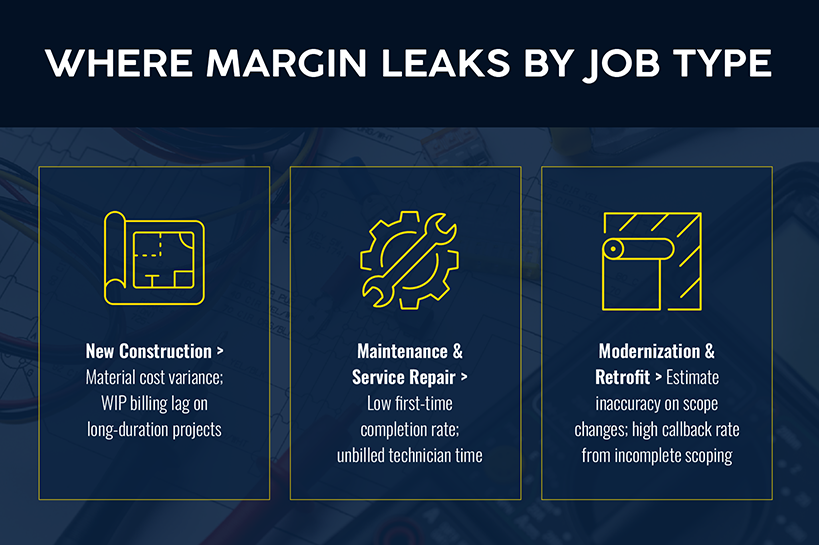
If you only track top-line business performance, you can't tell which service types pull their weight and which bleed margin. You need KPIs broken down by job type, division, and technician.
Core Operational KPIs for Electrical Businesses and Contractors
Operational metrics measure the efficiency of your field teams and raise red flags about profit before those problems show up in your financial reports.
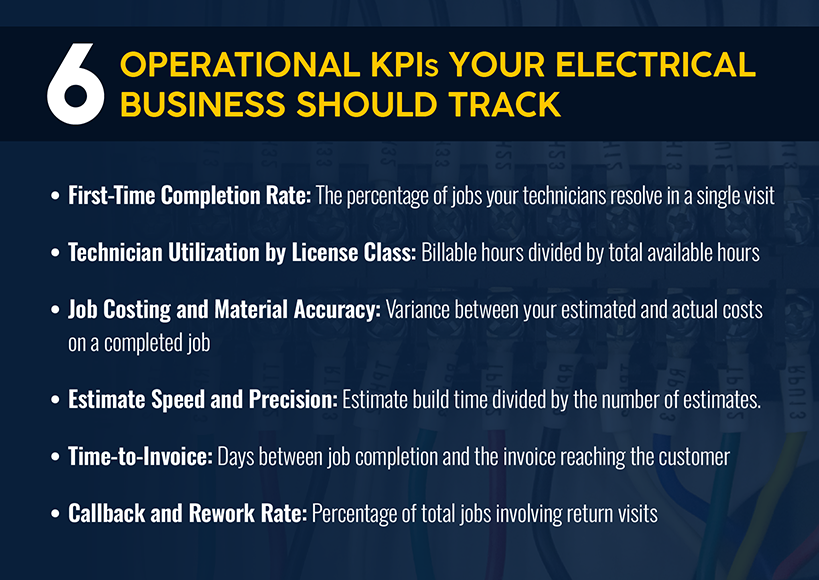
First-Time Completion Rate
The formula: (Issues Resolved on First Visit ÷ Total Service Calls) × 100.
First-time completion rate measures the percentage of jobs your technicians resolve in a single visit. The industry average sits around 78%. Top-performing electrical businesses hit 90% or higher. A reasonable target for most operations is 85%.
If you're sending technicians back to jobs, you're paying for labor twice, burning truck time, and delaying invoicing.
The operational fix: Track first-time completion by technician and by job type. If callbacks cluster around specific work categories, that's a training or scoping problem. If they cluster around specific technicians, that's a performance conversation.
Technician Utilization by License Class
The formula: (Billable Hours ÷ Total Available Hours) × 100, tracked by license class.
Technician utilization — billable hours divided by total available hours — averages 66% across the industry. Top-quartile businesses hit 82% or higher. A practical target for most operations is 75%.
Electrical businesses face an additional complication: License class. A master electrician running service calls that a journeyman could handle is an expensive scheduling inefficiency. Track utilization by license class, not just by headcount, to see whether your scheduling matches job types to the required skill.
The operational fix: Build job templates that specify minimum license requirements by job category.
Job Costing and Material Accuracy
The formula: ((Actual Job Cost − Estimated Job Cost) ÷ Estimated Job Cost) × 100.
Job costing accuracy measures the variance between your estimated and actual costs on a completed job. The industry benchmark is within 5% to 10% variance. Electrical work is especially vulnerable to material cost creep — conduits, wire, and breakers are affected by shifting prices and mid-job specification changes.
When a job estimated at $4,800 in materials closes at $5,400, you have a data problem.
The operational fix: Connect your estimated line items directly to purchase orders and inventory pulls so actual material usage feeds back into your estimating templates automatically.
Time-to-Invoice and Cash Flow
The formula: (Date Invoice Sent − Date Job Completed), averaged across all jobs.
Time-to-invoice measures the number of days between job completion and the invoice reaching the customer. The best practice for electrical service work is same day or within 48 hours of completion.
A business running $4 million in annual revenue with a 45-day DSO has roughly $493,000 tied up in receivables at any given time. Cutting that to 30 days frees up over $150,000 in working capital without adding a single new customer.
The operational fix: Same-day invoicing starts in the field. Empower your technicians to close out a job and trigger an invoice from a user-friendly mobile device without needing to visit the office.
Callback and Rework Rate
The formula: (Callbacks ÷ Total Jobs Completed) × 100.
Callback rate is the number of return visits required to fix something your team already worked on, expressed as a percentage of total jobs. The industry average is 6%. Top-performing businesses run under 2%.
A callback isn't just a cost — it's a customer trust problem, and a fast way to lose recurring business from commercial accounts and property managers.
The operational fix: Log the cause of every callback. If it's a material failure, that's a supplier issue. If it's incomplete scoping, that's a pre-job inspection problem. If it's workmanship, that's a training issue.
Financial KPIs Every Electrical Business Should Track
Operational KPIs tell you how the work is going. Financial KPIs tell you whether that work is building a sustainable business — and can help electrical businesses identify where they've long undercharged.
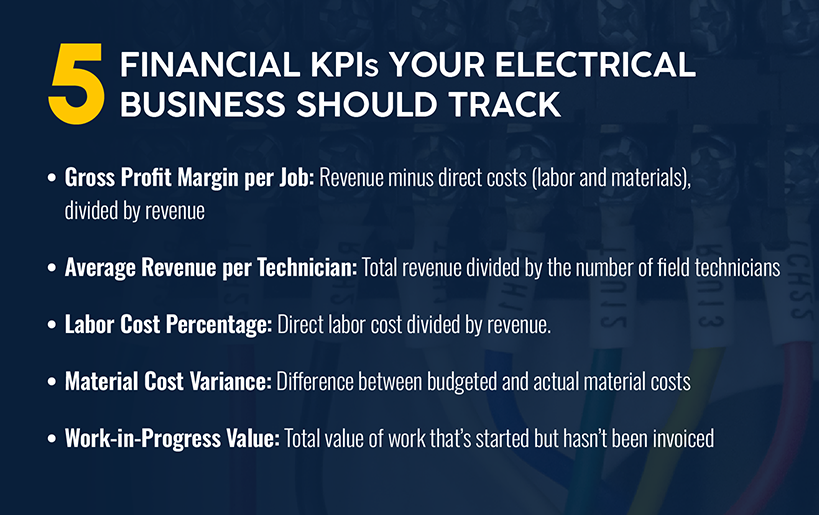
Gross Profit Margin per Job
The formula: ((Revenue − Labor and Material Costs) ÷ Revenue) × 100.
Gross profit margin is calculated as revenue minus direct costs (labor and materials), divided by revenue. For service-focused electrical businesses, the benchmark range is 30% to 50%. Break gross margin down by job type, service category, and customer segment — a blended number won't tell you which segment is actually driving profit.
The operational fix: If your gross margin is consistently below 35%, start with your labor and material cost capture. Margins that look thin on paper are often the result of unbilled labor and technicians spending time on-site that never gets invoiced.
Average Revenue per Technician
The formula: Total Revenue ÷ Number of Field Technicians (measured annually).
Revenue per technician is total revenue divided by the number of field technicians. For service-focused electrical businesses, the benchmark range is $250,000 to $400,000 per year per technician.
The operational fix: Look at revenue per technician and utilization rate together. Low revenue per tech, plus high utilization, means the problem is pricing. Low revenue per tech, plus low utilization, means the problem is scheduling and job volume.
Material Cost Variance
The formula: ((Actual Material Cost − Budgeted Material Cost) ÷ Budgeted Material Cost) × 100.
Material cost variance measures the difference between budgeted and actual material costs. A $200,000 commercial wiring project with a 7% material variance means $14,000 in unbudgeted cost.
The operational fix: Track material cost variance by supplier, job category, and material type. Price increases often show up in variance data before it's time to renegotiate contract rates.
Growth KPI Tracking for Electrical Businesses
Growth metrics connect your current operational performance to your pipeline and reveal what your business will look like in 12 months.
Estimate Win Rate
The formula: (Estimates Won ÷ Total Estimates Issued) × 100, tracked by job type and customer segment.
A healthy win rate for electrical businesses is 30% to 40%. A rate above 40% can indicate underpricing. A rate consistently below 25% points to pricing problems, proposal-quality issues, or a mismatch between the work you're bidding and the customers you're trying to win. Track win rate by job category and customer segment — a blended rate won't show you where you're actually competitive.
The operational fix: If your win rate is below 30%, pull your last 20 lost bids and look for a pattern. If you're losing on price, you have a positioning or cost problem. If you're losing without feedback, you have a follow-up problem.
Job Backlog Value
The formula: Total Backlog Value ÷ (Annual Revenue ÷ 365) = Days of Backlog Coverage.
For project-based electrical businesses, a healthy backlog is typically 90 to 120 days of revenue at the current run rate. Below 60 days signals a sales and pipeline problem.
The operational fix: Review your backlog weekly against your current field capacity to identify whether your scheduling can absorb what's in the pipeline or whether you need to hire, subcontract, or reschedule.
Collecting Reliable Electrical KPI Data
Electrical business KPIs are only as effective as the data behind them. Instead of adding more spreadsheets, you need to connect the systems where your data lives — estimates, field operations, inventory, invoicing — so the numbers flow automatically.
Simpro® does that for electrical businesses across service, project, and maintenance work.
- Real-time job costing keeps margin visibility active throughout a job, not just at closeout.
- Scheduling and inventory integration tracks labor allocation and connects material usage to job records, closing gaps that cause cost variance.
- Automated invoicing workflows help field teams process same-day invoicing without being late for the next job.
Nigel Bird of Electrical Infrastructure Services reported a sales increase of £250,000 during a six-month year-over-year period after implementing Simpro — that's what operational visibility does when it's connected end to end.
Ready to See What Your Numbers Are Actually Telling You?
If you've read this far, you probably know which electrical business KPIs you're not regularly tracking. And you might have a sense of what the gaps are costing you.
Simpro is purpose-built for electrical businesses that need that kind of operational infrastructure — a platform built around how electrical work actually runs.
Schedule a demo to see how Simpro surfaces the KPIs that matter for your business — in real time, by job type, and connected from estimate to invoice.